E10. GIT (Version Control)
Git is a free and open-source distributed version control system designed to handle everything from small to very large projects with speed and efficiency. Git is easy to learn and has a tiny footprint with lightning-fast performance. We will use Git and GitHub to save our work.
E12. YARN (Yet Another Package Manager)
YARN is a package manager that we will use to obtain our external libraries. Yarn caches every package it downloads so it never needs to download it again. It also parallelizes operations to maximize resource utilization so install times are faster than ever.
E14. Prettier (Opinionated Code Formatter)
Prettier is an opinionated code formatter. It enforces a consistent style by parsing your code and re-printing it with its own rules that take the maximum line length into account, wrapping code when necessary. This will help keep our code looking nice and save the tedious work of formatting.
E15. ESLint (Pluggable JavaScript Linter)
ESLint is a static code analysis tool for identifying problematic patterns found in JavaScript code. Rules in ESLint are configurable, and customized rules can be defined and loaded. ESLint covers both code quality and coding style issues. This will help reduce bugs as help ensure the quality of our code.
B14. Drawing with Polygons / Circles
In this lecture, we will be looking at using Data Densification, Table Calculations and the Polygon Mark Type to draw shapes. We will combine all our techniques to draw a few fun shapes and will be building up to drawing more complex objects.
B11. Data Densification
In this lecture, we are going to look into the technique of Data Densification; this technique allows us to take two points and create additional points between for manipulation, so in essence, making our data more dense.
E21. Exploring the Tableau Extension API
Now that we have downloaded the Tableau Extension API, we will go through the various folders, install the Tableau Extension API SDK Components, Build the TypeScript Samples, and test our extensions using a local server.
B27. Drawing your First Ring
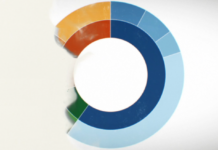
We are going to complete our first layer of our Sunburst using additional Table Calculations to position our segments around the circle. We will need to move our segments around and make sure they are relative to each other.
E05. Basic Programming Tutorials
This course does require a basic understanding of programming; if you are new to programming or need a refresher course, I would highly recommend spending time to go through the following tutorials
E19. Project Introduction
In this section, we are going to develop our first Tableau Extension, although, it will not do much for now, we will build our skeleton and make use of all the installed applications, tools and packages.


