B22. Sketching your Design
The final step is choose and sketch out our bespoke data visualisation; this will give us our basis for our Tableau design and build using the techniques we have learned so far.
B04. Why Bespoke Data Visualisations?
We will talk about the reasons for learning more about bespoke data visualisations and how, through learning about bespoke data visualisations, you will improve your Tableau dashboarding skills.
B11. Data Densification
In this lecture, we are going to look into the technique of Data Densification; this technique allows us to take two points and create additional points between for manipulation, so in essence, making our data more dense.
E02. About this Course
We will talk about the progressive nature of this course and introduce the various sections.
B05. Using Bespoke Data Visualisations
There is some contention and disagreements about the use of bespoke data visualisations, and we will discuss the pros and cons of bespoke data visualisations, when to use them, and more importantly, when not to use them.
E08. VS Code (Integrated Development Environment)
Microsoft VS Code is a code editor refined and optimized for building and debugging modern web and cloud application. The best part, Microsoft VS Code is a free Integrated Development Environment (IDE) with an abundance of extensions.
B26. Drawing your First Segment
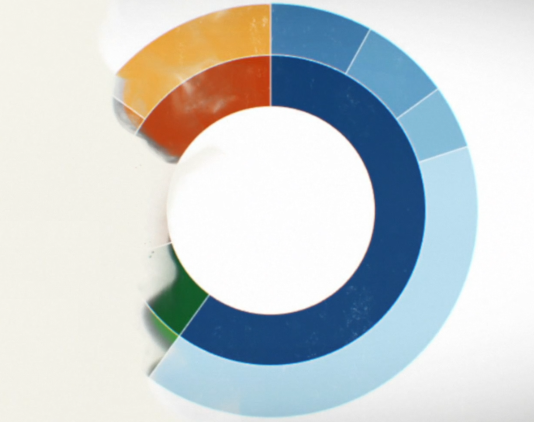
Using our prepared data source, we are going to draw our the first segments of our Sunburst chart so that we have a basic understanding of the mechanics. This is always the important first step as we will very quickly see if this is going to be fit for purpose.
B21. Distilling the Essence
Once you have found some inspiration, we will go through the process of distilling this down to its fundamental parts. We will work on pen and paper, go through my process, and start sketching out our various possibilities for our bespoke data visualisation.
B30. Summary
That must have felt like a mini marathon, but alas we are done and will now do a review of the end-to-end design, data preparation, and build of our Sunburst Bespoke Data Visualisation.
B29. Adding your Final Touches
Now that we have our Sunburst completed, we will look into adding our final touches and work on additional cosmetics to ensure that we have a very nice look at feel to our bespoke data visualisation.


