

In the recent 2nd #IronViz Feeder round for the Global competition, I created a sectioned Radial Jitter plot, which was adapted from the Tableau Magic Circular Jitter Plot tutorial. You can see how I used his Radial Jitter Plot to great effect in my Music theme viz: The Golden Record.

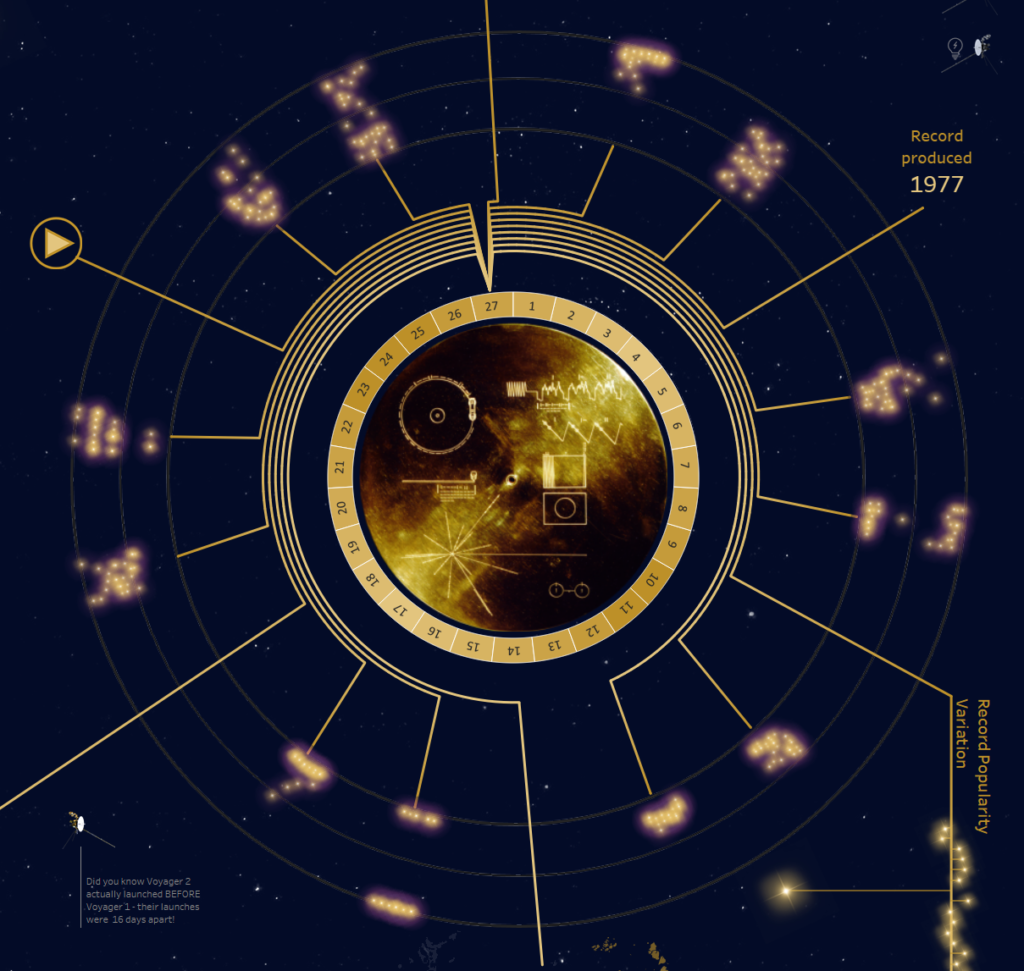
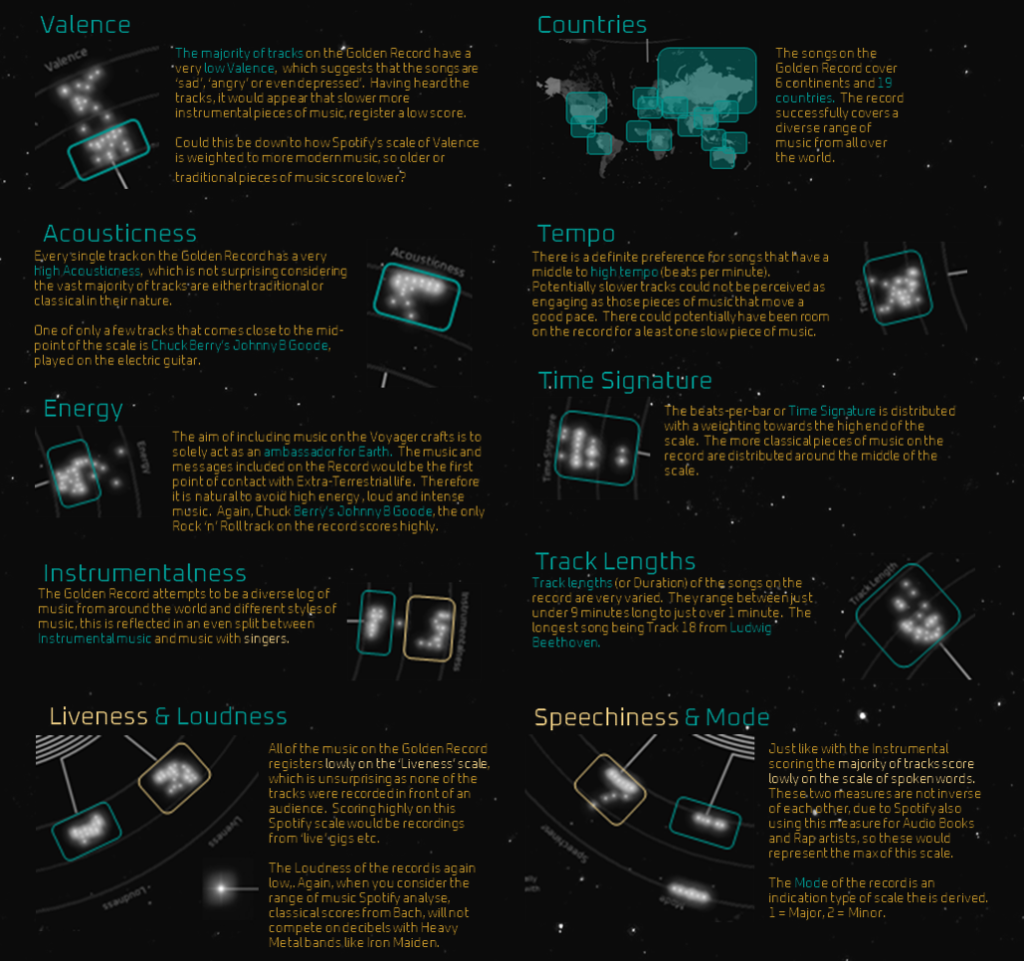
In this visualisation, I plotted each track on the Golden record against 12 different track musical features, and in standard jitter plot fashion, each track is jittered on the one axis (in this case, around the radial circumference) and the measure value denotes the height of the jitter (or distance from the centre of the radial).
In my visualisation, I showcase how you can easily spot patterns using a sections Radial Jitter Plot.

The following explains how to create a Sectioned Radial Jitter Plot.
Aim
To create a standard Jitter plot for Products Sold, broken into Sub-Category sections and based on Sum of Sales; but the twist being to plot the Jittered Sub-Categories around a Radial, so that they plot outwards from the centre.
Data
For this tutorial, connect to your Desktop Superstore data set.
Parameters
Before we go into the calculations we need to set up a few parameters to refer to in those calculations. These parameters allow you to alter certain elements of the calculation to provide control on making the radial work visually for what you need.
All parameters are set up as Floats with a Range, to allow for use as a slider parameter.
Angle Adjustment Parameter
// To control the start point around the clock from which the plotting of the Jitters beings from
- Set Name to Angle Adjustment.
- Set Data type to Integer.
- Set Allowable value to Range:
- Set Minimum to 0.
- Set Maximum to 360.
- Set Step size to 10.
- Set Current value to 110.
Distance Adjustment Parameter
// To control the space from the centre of the radial, the upper range is based off of Sum of Sales values.
- Set Name to Distance Adjustment.
- Set Data type to Integer.
- Set Allowable value to Range:
- Set Minimum to 0.
- Set Maximum to 100,000.
- Set Step size to 10,000.
- Set Current value to 30,000.
Percent of Radial Parameter
// Provides control on the width of each Jitter section in terms of degrees. Adjust to avoid overlapping of Jitter Sections.
- Set Name to Percent of Radial Parameter.
- Set Data type to Integer.
- Set Allowable value to Range:
- Set Minimum to 0.
- Set Maximum to 100.
- Set Step size to 1.
- Set Current value to 11.
Calculated Fields
These calculated fields are similar in nature to those explained in Circular Jitter Plot tutorial.
Sub Cat ID
// Setting an ID value against each Dimension, could be done with Index() also.
CASE [Sub-Category]
   WHEN "Accessories" THEN 1
   WHEN "Appliances" THEN 2
   WHEN "Art" THEN 3
   WHEN "Binders" THEN 4
   WHEN "Bookcases" THEN 5
   WHEN "Chairs" THEN 6
   WHEN "Copiers" THEN 7
   WHEN "Envelopes" THEN 8
   WHEN "Fasteners" THEN 9
   WHEN "Furnishings" THEN 10
   WHEN "Labels" THEN 11
   WHEN "Machines" THEN 12
   WHEN "Paper" THEN 13
   WHEN "Phones" THEN 14
   WHEN "Storage" THEN 15
   WHEN "Supplies" THEN 16
   WHEN "Tables" THEN 17
END
Angle between each Jitter Section
// Used to decide how many dimensions around the radial there will be
// for Sub-Category, it is 17 and then divide 360 Degrees by this Count
// Giving the Angle between each of the dimensions around the radial
360 / {COUNTD([Sub-Category])}
Distance
// Your chosen measure to plot outwards from the centre.
SUM([Sales])

// Parameter used to create a gap from the centre of the Radial.
+ [Distance Adjustment]
Index
// Used to determine how to plot each mark round the radial
// ID of each dimension (for Sub-Category i.e. 1 to 17)
// Multiplied by the Angle between each Dimension gives a
// unique starting position for each of the 17 sub categories
// around the radial with equal spacing.
((AVG([Sub Cat ID])*AVG([Angle between each Jitter Section]))

// Pulling this lever (parameter) will move those start positions
// around the radial in terms of degrees
* [Angle Adjustment])

// Each mark is given an Index number and randomised using
// the % modulo and the parameter
+ (Index()-1)%[Percent of Radial]
X
// Trigonometry to plot the X coordinate
SIN(RADIANS([Index]))*[Distance]
Y
// Trigonometry to plot the Y coordinate
COS(RADIANS([Index]))*[Distance]
That’s it from the calculations.
Worksheet
Now we build the view…
- Change the Mark Type to Circle.
- Place Sub-Category onto Detail.
- Place Product Name onto Detail.
- Place X onto Columns.
- Place Y onto Rows.
You will now end up with something like this….

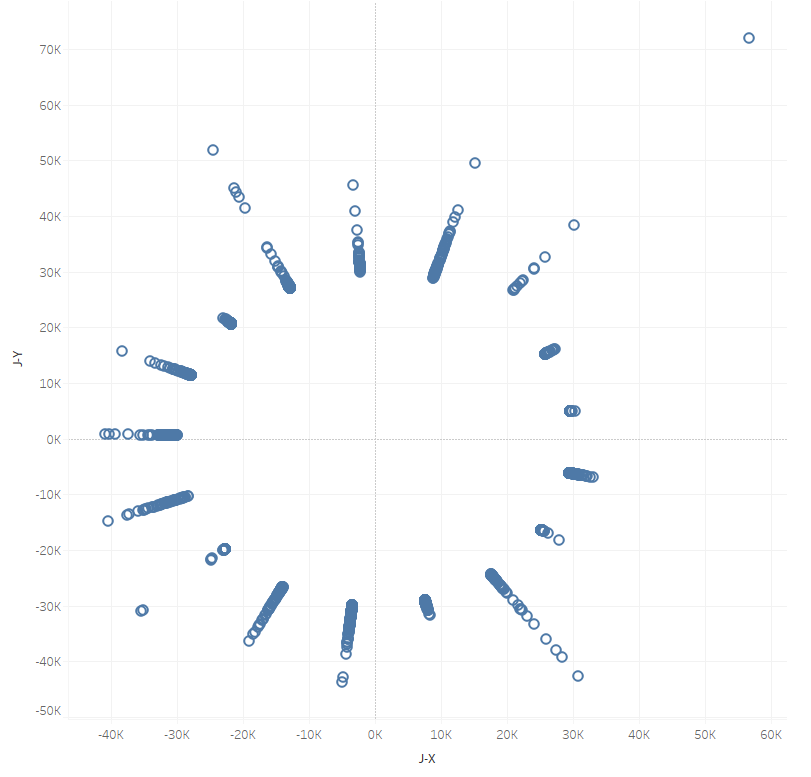
Correcting the Table Calculations will produce the Jitter effect we are looking for…
- Edit the X Table Calculation.
- Set Compute Using to Specific Dimensions.
- Tick Sub-Category.
- Tick Product Name.
- Edit the Y Table Calculation.
- Set Compute Using to Specific Dimensions.
- Tick Sub-Category.
- Tick Product Name.
Formatting
Adjust the formatting by:
- Hide the Grid Lines.
- Hide the Zero Lines.
- Hide the Y-Axis Header.
- Hide the X-Axis Header.
- Set Sub-Category to colour.
You should now end up with something like this! A sectioned Radial Jitter Plot!

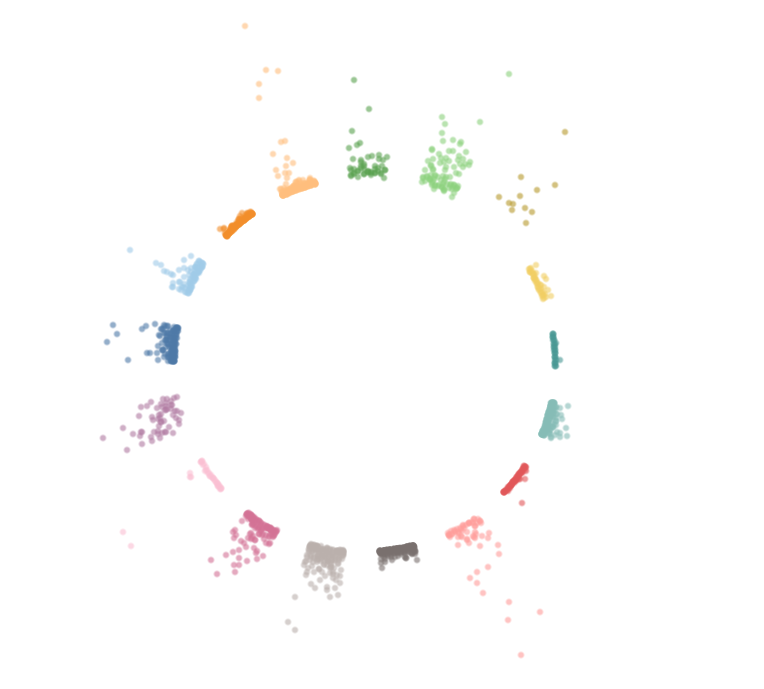
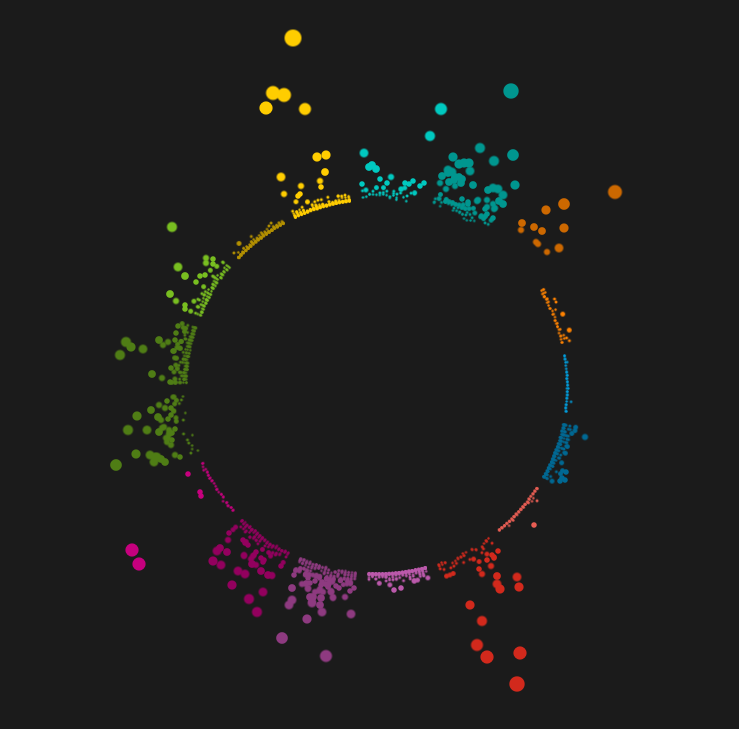
With a little more formatting, we can make it look a little more interesting…
- Set the Colour Opacity to 70%.
- Set the Background colour to #1b1b1b.
- Drag Sum of Sales to Size and adjust.
- Change the colour palette to something more interesting
And voila! A sectioned Radial Jitter Plot!

Closing
Thank you for reading!
Please check out the Tableau Workbook of this Tutorial, which is available on my Tableau Public site, here.
Do feel free to contact me if you have any questions, I am always available on Twitter or just follow my Tableau Public profile to see what I do next!
Thanks again
Sam