Animated Chess Tutorial in Tableau
I was looking for a new hobby during the COVID lockdowns, so I decided to go back to my childhood and to check out Magic the Gathering; if you do not...
Creating Bespoke Data Visualisations in Tableau Part 2
In July 2019, I released my course on Creating Bespoke Data Visualisations in Tableau on Udemy, the aim of this course was to provide more information, context to complement the huge...
Tableau QT: Dynamic Worksheet Selector
I have been asked a few times on how we can add the ability to swap worksheets dynamically. Here is a nice and simple quick tip on selecting worksheets using a...
Creating Pointed Podium Bar Charts in Tableau
A few weeks ago I created a tutorial for making a Podium Bar Chart. This week we are going to draw a Point Podium Bar Chart in Tableau using Polygons. I...
Video: Tableau with Music / Marimekko
Using a few neat tricks and some Table Calculations, we have created this awesome chart in Tableau. Enjoy
https://youtu.be/6FGSGu5QLKo
YouTube Channel
Written Tutorial
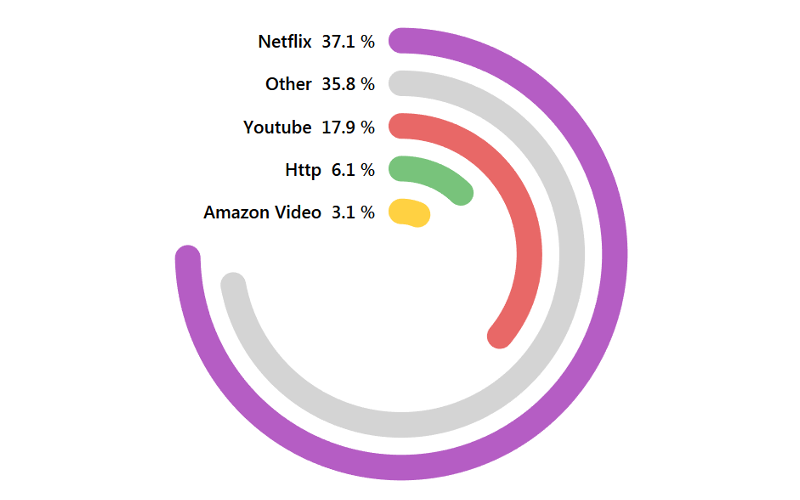
Creating Circular KPIs in Tableau
After the Barcelona vs Bayern Munich Semi-Finals for the Champions League 2020, I was browsing Twitter to see reactions and saw a circular KPI visualisation and thought that I would create...
Video: Tableau with Music / Control Charts
Using a few neat tricks and some Table Calculations, we have created this awesome chart in Tableau. Enjoy.
https://youtu.be/2qQvQNtCUzY
YouTube Channel
Written Tutorial
Tableau QT: Rounded Gantt Chart
Something very nice and simple, here is a Tableau Quick Tip on Creating a Rounded Gantt Chart within 10 minutes or less.
Note: This is an alternative type of data visualisation, and...
Single Level Sankey Diagram
I saw this data visualisation while being a judge for #IronViz and thought that I should add this to my library of cool and interesting data visualisations. I hope you enjoy...
Tableau QT: Podium Bar Chart
Thinking about the olympics and podiums, so here is a Tableau Quick Tip on Creating a Podium Bar Chart within 10 minutes or less.
Note: This is an alternative type of data...


