Drawing Pareto Charts in Tableau
Pareto Charts is a type of chart that combines both a Bar Chart and Line Chart; this chart type was named after Vilfredo Pareto who came up with the Pareto Principle...
Drawing Candlestick Charts in Tableau
I have been doing alot of research for an article that I am writting about the Salesforce Acquisition of Tableau. As such, I was looking at the Stock Prices and thought...
Hex Maps in Tableau
I have always had a thing for Hex Maps, so I decided to finally write a tutorial on how you can generate some very interesting Hex Maps. With the help of...
Tableau 2019.2: MakePoint and MakeLine
Tableau 2019.2 was released on Tuesday 21st May 2019 and comes with some very nice features. In this article, we are going to spend the next 10 minutes to look into...
Sigmoid Area Charts in Tableau
I was working on an update to our Curved Line Charts and thought about turning this onto a Curved Area Chart, or Sigmoid Area Chart. I am going to be exploring...
Arrow Doughnut Chart
I saw the following data visualisation and thought that I had to create it, but once I created this I had no idea what I would call it. Baseball Stitches, Chevron...
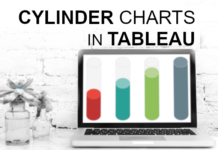
Cylinder Charts in Tableau
I was going through Google looking for data visualisation inspiration and came across a thread in the Tableau Forum which talks about creating a Cylinder Chart, and more interesting, if it...
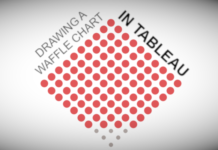
Waffle Charts in Tableau
This is one of the most requested tutorials, so I thought why not write it for a little fun. Yes, it a fun Waffle Chart. Now, I could use a scaffold...
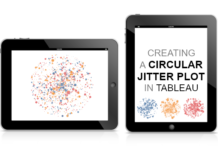
Circular Jitter Plots in Tableau
Yes, I have been experimenting with Jitter Plots recently, and created the following Circular Jitter Plot in Tableau; this type of chart does create a distinct and unique look, so I...
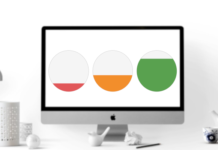
Filled Circle Charts in Tableau
I created this tutorial a little while ago, but the math did not quite add up, so I had to remove the tutorial. After a little while decided to revisit this, and as such, here is my latest version of my Filled Circle Tableau data visualisation tutorial.


