Cryptocurrency Dashboard Full Tutorial
Once a month, I am going to write a full feature-length tutorial on creating an intricate multi-feature dashboard for you to work through and enjoy. We are going to start with...
Creating Radial Jitter Bar Charts in Tableau
I created this a while ago, and only now have had a chance to write a tutorial on creating Radial Jitter Bar Charts. Truth be told, I spent time digesting the...
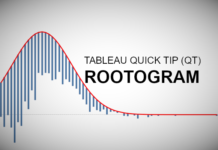
Tableau QT: Rootogram
Last week our Tableau Quick Tip was on creating a Histogram with a Normal Distribution Curve. This week we are going to build a variation of this and our Rootogram (hanging...
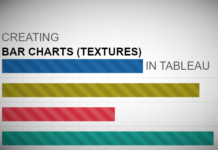
Create a Bar Chart (Textured) in Tableau
Requested by a student, here is a tutorial on adding Textures to Bar Charts to create a very nice and interesting effect. This uses data densification as well as images in...
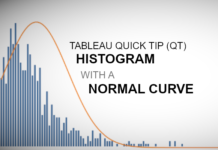
Tableau QT: Histogram with Normal Curve
Welcome to 2020. Hopefully, this will be the start of a glorious year, and we at Tableau Magic are definitely excited for things to come. Here is our first Tableau Quick...
Creating a Gradient Pie in Tableau
Welcome back everyone. This is going to be a very exciting 2020 for Tableau Magic, and we truly hope you come along with us for the ride. To start off with,...
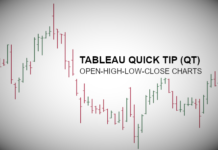
Tableau QT: OHLC Charts
In this Tableau Quick Tip, we are going to create an Open-High-Low-Close (OHLC) chart in Tableau, we will do this within 5 mins or less.
Data
Let us start by loading the following...
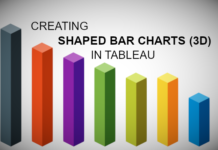
Shaped Bar Charts (3D) in Tableau
We previously had an article about creating Shaped Bar Charts in Tableau; in that previous tutorial, we used data densification to create a different look and feel for our bar charts....
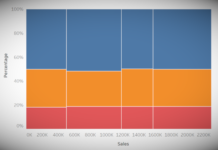
Creating a Marimekko Chart in Tableau
To close off there year, he is a quick and simple tutorial on creating a Marimekko Chart in Tableau. No data densification or any such data tricks. Just a few Table...
Creating Gradient Half Circle Charts in Tableau
Recently, I explored the idea of gradients in my Gradient Bar Chart tutorial. After release, I was asked to explore gradients a bit more, so I decided to look at circles...


