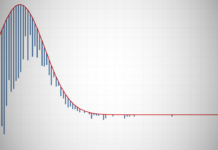
Video: Tableau with Music / Rootogram
Tableau with Music / Rootogram. We will create several Level of Detail Expressions to create this unique Rootogram Diagram. See how each the distribution of your data compares to the Normal...
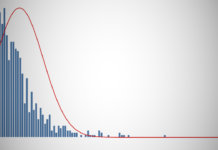
Video: Tableau with Music / Histogram with a Normal Curve
Tableau with Music / Histogram with a Normal Curve. We will create several Level of Detail Expressions to create this data visualisation. See how each the distribution of your data compares...
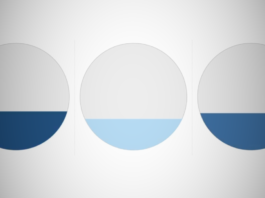
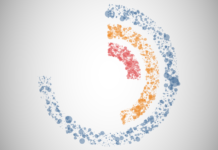
Video: Tableau with Music / Half-Circle Timelines
Tableau with Music / Half-Circle Timelines. We will combine several Table Calculations to create this visualisation using the Sample Superstore Data Set. Nice and simple.
https://youtu.be/XnH-jqedyKM
Written Tutorial
YouTube Channel
Video: Creating a Cryptocurrency Tableau Dashboard (57 mins)
This is my first long-form end-to-end Tableau Dashboard tutorial. While filming, I was overthinking the editing and production quality, which meant that I almost gave up. In the end, I came...
Video: Tableau with Music / Radial Jitter Bar Chart
Tableau with Music / Radial Jitter Bar Charts. We will combine the undocumented RANDOM() function with several Table Calculations to create this visualisation using the Sample Superstore Data Set. #NoDataDensificationRequired
https://youtu.be/YBtiXPHxwyw
Written Tutorial
YouTube...
Video: Tableau with Music / Curved (Sigmoid) Area Chart
Tableau with Music / Curved (Sigmoid) Area Chart. This is a very different take on an area chart using Data Densification, Table Calculations and the Sigmoid Function to create this using...
Video: Tableau with Music / Square Bump Chart
Tableau with Music / Square Bump Chart. This awesome variation of your standard Bump Chart (League Table) using Data Densification and Table Calculations to create this using the Sample Superstore Data...
Video: Tableau with Music / Curve Bar Charts
Tableau with Music / Curved Bar Chart. This awesome variation of a Bar Chart leverages Data Densification and Table Calculations to create this awesome effect over the Sample Superstore Data Set.
https://www.youtube.com/watch?v=9gtdra7260U
Written...


