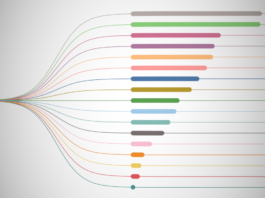
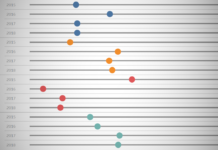
Video: Tableau with Music / Single Level Dendrogram
Using a few neat tricks and some Table Calculations, we have created this awesome chart in Tableau. Enjoy.
https://youtu.be/AYeb8rb_FZA
Written Tutorial
YouTube Channel
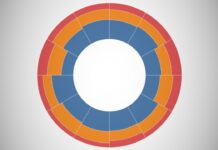
Video: Tableau with Music / Radial Stacked Bar Charts
Using a few neat tricks and some Table Calculations, we have created this awesome chart in Tableau. Enjoy.
https://youtu.be/r5TgiLyHe4A
Written Tutorial
YouTube Channel
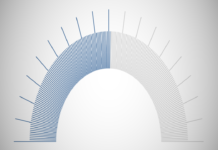
Video: Tableau with Music / Half Circle Chart
Using a few neat tricks and some Table Calculations, we have created this awesome chart in Tableau. Enjoy.
https://youtu.be/Y6fS_QLw9yk
YouTube Channel
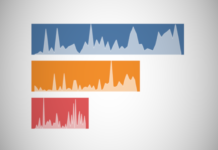
Video: Tableau with Music / Bar Trend Chart
Using a few neat tricks and some Table Calculations, we have created this awesome chart in Tableau. Enjoy.
https://youtu.be/8nVY98Ouupg
Written Tutorial
YouTube Channel
Video: Tableau with Music / Gauge Chart
Using Parameters, Bins and quite a few Table Calculations, we have created this awesome Gauge in Tableau. Enjoy.
https://youtu.be/v75ERzagsXc
Written Tutorial
YouTube Channel
Video: Tableau with Music / Volume Dial Charts
This is something extremely easy and quick to create. Enjoy.
https://youtu.be/vrTEdoJKsNk
Written Tutorial
YouTube Channel
Video: Tableau with Music / Radial Column Charts
We will combine several Table Calculations to create this visualisation using the Sample Superstore Data Set. I hope you enjoy.
https://youtu.be/LAUUnzkLmJc
Written Tutorial
YouTube Channel
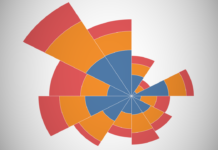
Video: Tableau with Music / Coxcomb Chart
We will combine several Table Calculations to create this visualisation using the Sample Superstore Data Set. Also known as the Nightingale Rose.
https://youtu.be/Ubhb0CIdcSM
Written Tutorial
YouTube Channel
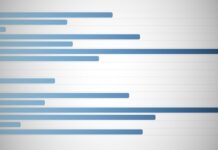
Video: Tableau with Music / Gradient Bar Chart
We will combine several Table Calculations to create this visualisation using the Sample Superstore Data Set. I hope you enjoy this.
https://youtu.be/7SfLzRP-eME
Written Tutorial
YouTube Channel
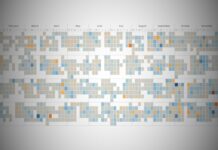
Video: Tableau with Music / Calendar Table
Using a simple date calculation, we are going to create this visualisation using the Sample Superstore Data Set. Nice and simple.
https://www.youtube.com/watch?v=7yrwproUcpY
Written Tutorial
YouTube Channel


