Video: Tableau with Music / Curve Bar Charts
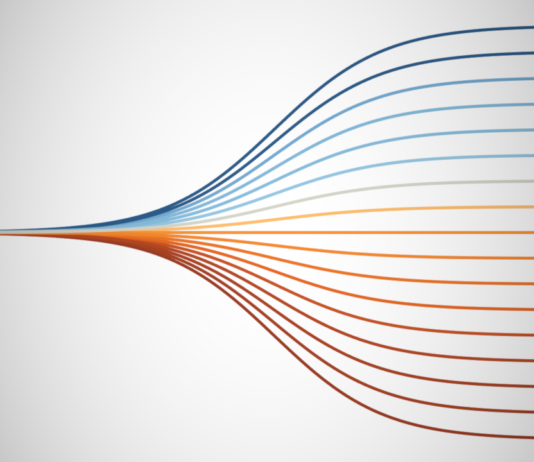
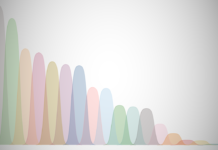
Tableau with Music / Curved Bar Chart. This awesome variation of a Bar Chart leverages Data Densification and Table Calculations to create this awesome effect over the Sample Superstore Data Set.
https://www.youtube.com/watch?v=9gtdra7260U
Written...
Video: Tableau with Music / Radial Jitter Bar Chart
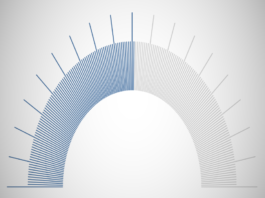
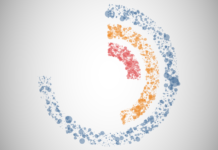
Tableau with Music / Radial Jitter Bar Charts. We will combine the undocumented RANDOM() function with several Table Calculations to create this visualisation using the Sample Superstore Data Set. #NoDataDensificationRequired
https://youtu.be/YBtiXPHxwyw
Written Tutorial
YouTube...
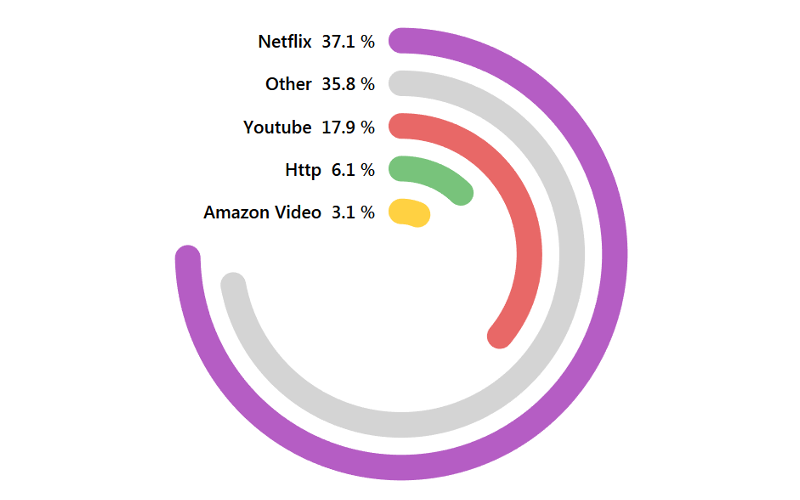
Video: Tableau with Music / Radial Column Charts
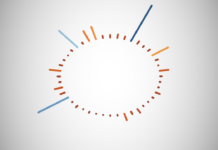
We will combine several Table Calculations to create this visualisation using the Sample Superstore Data Set. I hope you enjoy.
https://youtu.be/LAUUnzkLmJc
Written Tutorial
YouTube Channel
Video: Tableau with Music / Dendrogram with Rounded Bar Charts
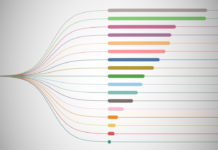
Using a few neat tricks and some Table Calculations, we have created this awesome chart in Tableau. Enjoy.
https://youtu.be/ywH3qFD9UNI
Written Tutorial
YouTube Channel
Video: Tableau with Music / Calendar Table
Using a simple date calculation, we are going to create this visualisation using the Sample Superstore Data Set. Nice and simple.
https://www.youtube.com/watch?v=7yrwproUcpY
Written Tutorial
YouTube Channel
Video: Tableau with Music / Control Charts
Using a few neat tricks and some Table Calculations, we have created this awesome chart in Tableau. Enjoy.
https://youtu.be/2qQvQNtCUzY
YouTube Channel
Written Tutorial
Video: Tableau with Music / Bar Trend Chart
Using a few neat tricks and some Table Calculations, we have created this awesome chart in Tableau. Enjoy.
https://youtu.be/8nVY98Ouupg
Written Tutorial
YouTube Channel
Video: Tableau with Music / Histogram with a Normal Curve
Tableau with Music / Histogram with a Normal Curve. We will create several Level of Detail Expressions to create this data visualisation. See how each the distribution of your data compares...
Video: Tableau with Music / Marimekko
Using a few neat tricks and some Table Calculations, we have created this awesome chart in Tableau. Enjoy
https://youtu.be/6FGSGu5QLKo
YouTube Channel
Written Tutorial
Video: Tableau with Music / Curved (Sigmoid) Area Chart
Tableau with Music / Curved (Sigmoid) Area Chart. This is a very different take on an area chart using Data Densification, Table Calculations and the Sigmoid Function to create this using...


