")


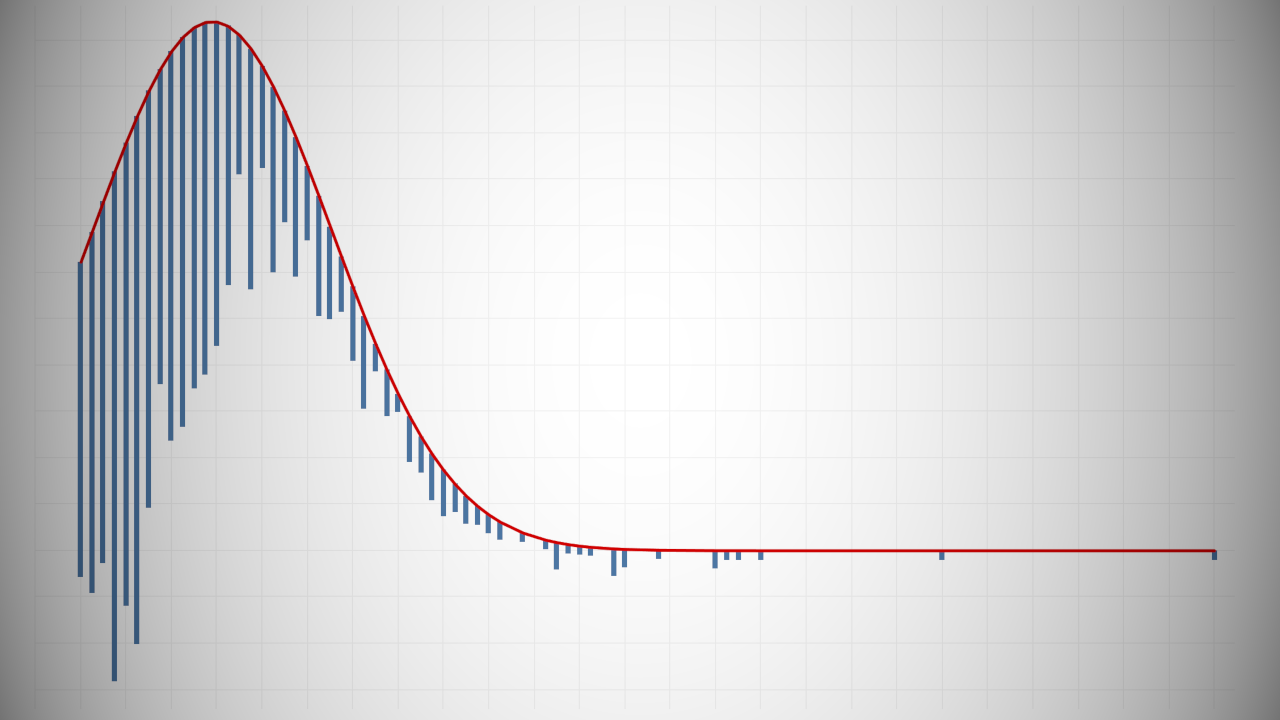
Tableau with Music / Rootogram. We will create several Level of Detail Expressions to create this unique Rootogram Diagram. See how each the distribution of your data compares to the Normal (Gaussian Distribution) Curve but attaching the Histogram to the Normal Curve.