Drawing Process Circles in Tableau
I do love drawing visualizations in Tableau and every time I see something interesting on a website, PowerPoint deck, magazine or any other presentation tool, the first thing that comes to...
Drawing Satellite Charts and Variations in Tableau
A lot of the articles written have either come from browsing bespoke designs or through client requests. I am normally the one that is called in when a client requests a...
Drawing Google Logos
I do not believe that everything you do in Tableau has to be serious, and sometimes, just sometimes, it is good to have some fun. As such, we are going to...
Radial Bar Chart Tutorial
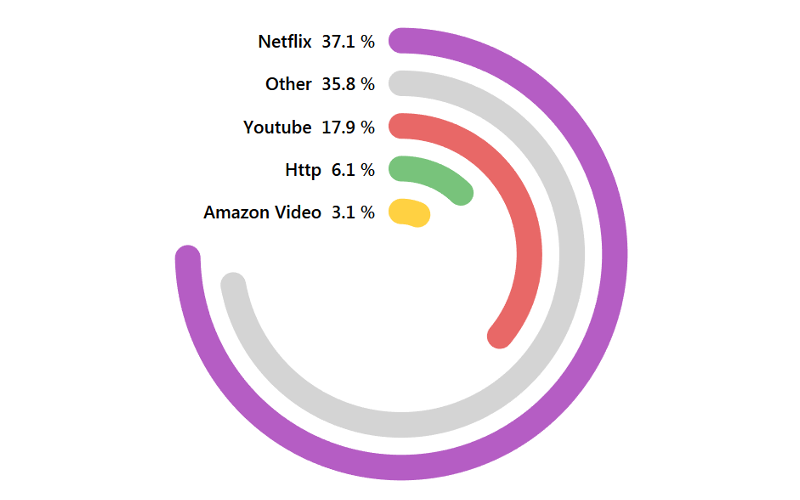
I love drawing data visualisations with Tableau and in this tutorial, we are going to build Radial Bar Chart. For my data set, I am going to use the #MakeoverMonday’s American...
Double, Spaced Doughnut Chart Tutorial
After the United Kingdom 2017 General Election, on Thursday 8th June 2017, I had many conservations about our First Past The Post system (FPTP), and why we do not have a Proportional...
Dual-Metric Doughnut Chart Tutorial
I created this data visualisation in Tableau when I was exploring Sunburst charts, and drawing polygons, but never did release an article on it. But given I just finished my article...
Sin Function
In mathematics, the sine is a trigonometric function of an angle. The sine of an acute angle is defined in the context of a right triangle: for the specified angle, it...
INDEX() Table Calculation
The INDEX() function returns the index of the current row in the partition, without any sorting with regard to value. The first-row index starts at 1. For example, the table below...
#MakeoverMonday
Makeover Monday is a wonderful community initiative for developing your Tableau skills, having fun and meeting loads of people while you are at it; when I have free time from work,...
Marketing Dashboards: The Do’s & Don’ts
Analytics dashboards are a critical resource for marketing teams that help support their roles and responsibilities, strategic planning, and data-driven decision-making in their daily routines.
With rich data to glean, marketers—especially CMOs—now...


