My Top 5 Free Stock Images
I have always had a tough time with backgrounds images for Data Visualizations. On one hand, they can enhance the appeal and engagement of a dashboard if used well, and on...
Information is Beautiful by David McCandless
A colleague got me a copy of Information is Beautiful by David McCandless as a present a few years ago, and still sits on my coffee table and is still a...
Inspired Dashboard Designs
I am always looking for Dashboards designs for inspiration, and in this article, I have given several links to amazing looking dashboards. It may be possible to create some of the...
Understanding Level of Detail (LOD) Expressions
Prior to Level of Detail (LOD) Expressions, we had to make a extensive use of Table Calculations, but LOD has added a new element to the game and well worth looking...
10 Best Practices for Building Effective Dashboards
This Tableau Whitepaper requires registration to read but essential reading for all developers. 10 Best Practices for Building Effective Dashboard is there as a timeless reference.
"When a dashboard is done right,...
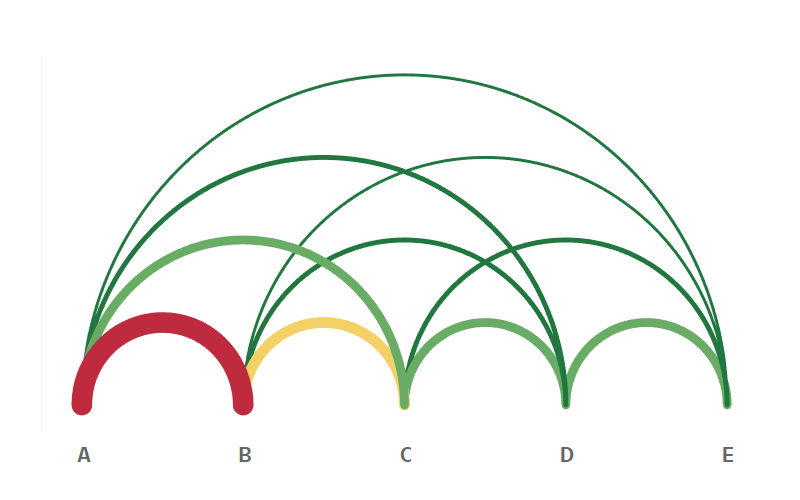
Arc Chart Tutorial
After years of using Tableau, I was finally given a use case that would allow me to create an Arc Chart; I always strive to build the best visualization for the client’s requirements. The client wanted to visualize...
Dot Matrix Tutorial
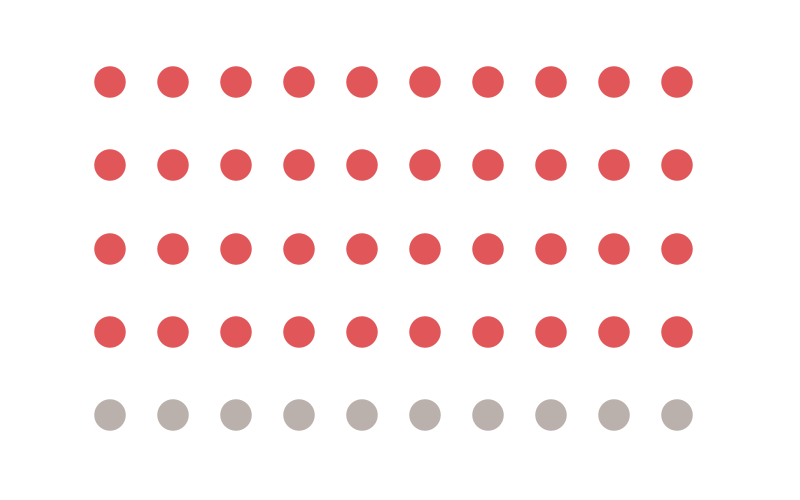
A friend messaged me to ask he could create a grid layout for different visualisations, for example, a 3×3 grid. I immediately thought about a Dot Matrix visualization and how I could create...
Pointed Radial Bar Chart Tutorial
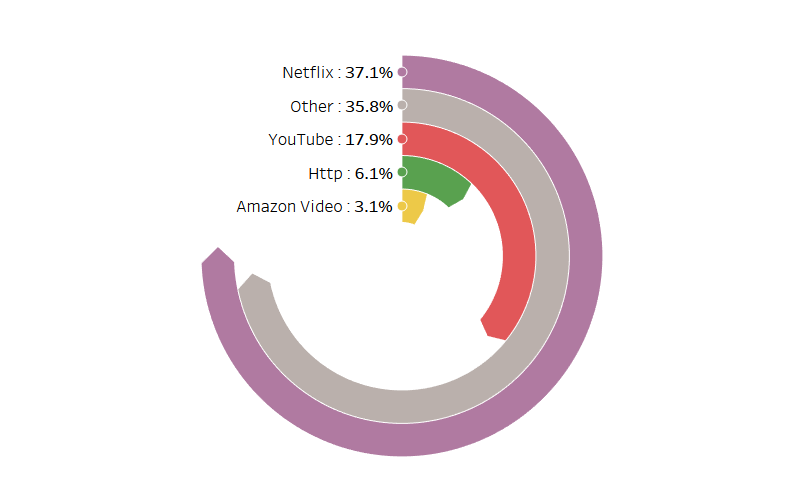
In September 2016, I wrote a tutorial titled Tableau Rings which was a step-by-step guide to create a Radial Bar Chart. To my surprise, this tutorial went on to be my...
Google Material Design Palette
This information has been taken from the official Google Material Design Website. For more information click HERE
Material Design Goals
Create a visual language that synthesizes classic principles of good design with the innovation...
Sunburst Chart Tutorial
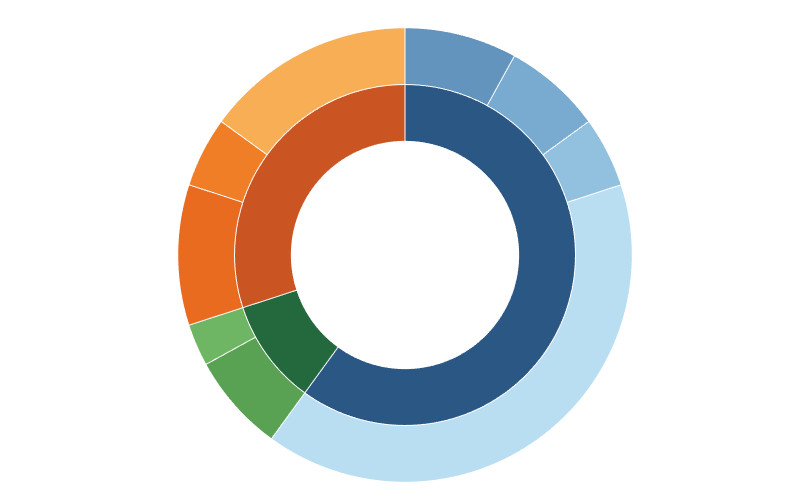
When I started to learn Tableau, I remember being completely amazed and confused about how to build Bora Beran’s blog on Sunbursts; I could not believe that this was possible in Tableau...


