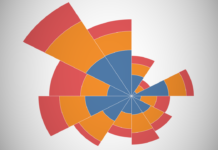
Video: Tableau with Music / Coxcomb Chart
We will combine several Table Calculations to create this visualisation using the Sample Superstore Data Set. Also known as the Nightingale Rose.
https://youtu.be/Ubhb0CIdcSM
Written Tutorial
YouTube Channel
Tableau QT: Negative Space Area Charts
Two weeks ago, I released a tutorial on a Negative Space Bar Chart, and this week, we are going to be creating a Negative Space Area Chart, and do this within...
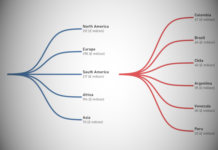
Creating a Multi-Level Dendrogram Charts in Tableau
Since I released my Dendrogram tutorial I have been inundated with requests on how to a multi-level version. So, in this tutorial, we are going to leverage some interesting techniques to...
Video: Tableau with Music / Gradient Bar Chart
We will combine several Table Calculations to create this visualisation using the Sample Superstore Data Set. I hope you enjoy this.
https://youtu.be/7SfLzRP-eME
Written Tutorial
YouTube Channel
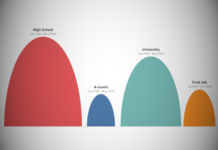
Creating Half Circle Timelines Variation in Tableau
Someone reached out to me and asked me if I could help him visualise several milestones in his career using my initial Half Circle Timelines tutorial. My previous tutorial had equal...
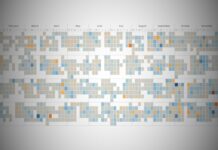
Video: Tableau with Music / Calendar Table
Using a simple date calculation, we are going to create this visualisation using the Sample Superstore Data Set. Nice and simple.
https://www.youtube.com/watch?v=7yrwproUcpY
Written Tutorial
YouTube Channel
Tableau QT: Negative Space Bar Charts
We are going to have and hopefully learn a simple and effective technique. In this Tableau quick tip, we are going to walkthrough the creation of a Negative Space Bar Chart...
Creating a Spiral Stacked Line Chart in Tableau
Another fun and interesting bespoke Data Visualisation in Tableau; requested by a student, here is a tutorial on created a Spiral Stacked Line Charts in Tableau. I hope you enjoy this.
Note:...
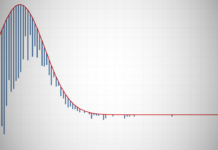
Video: Tableau with Music / Rootogram
Tableau with Music / Rootogram. We will create several Level of Detail Expressions to create this unique Rootogram Diagram. See how each the distribution of your data compares to the Normal...
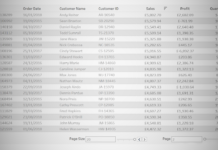
Tableau QT: Table Pagination
Something nice and simple. In this Tableau quick tip, we are going to walk through a simple technique for Table Pagination in Tableau, in 5 minutes or less.
Data
We will start by...


