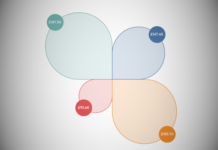
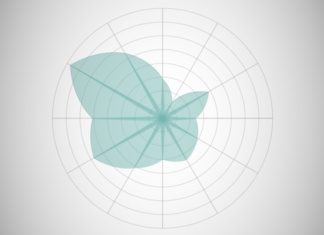
Creating Petal (Polygon) Diagrams
I was experimenting with possible ways of adding labels onto Polygon based data visualisations and think I might have something. With that said, do enjoy our latest tutorial on creating Petal...
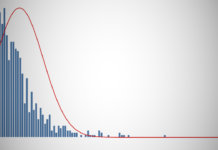
Video: Tableau with Music / Histogram with a Normal Curve
Tableau with Music / Histogram with a Normal Curve. We will create several Level of Detail Expressions to create this data visualisation. See how each the distribution of your data compares...
Tableau QT: KPI Text Indicator
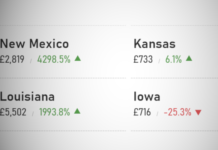
A lot of the dashboards I create today are Executive KPI Dashboards; this basically means KPIs and indicators. In this Tableau, Quick Tip, we are going to build a simple KPI...
Creating Floating Bar Charts with Shaped Background
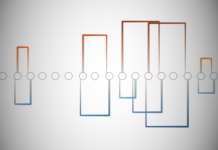
I have seen some amazing data visualisations using floating Worksheets, but a student asked me if we can create a floating bar chart effect in Tableau, so here we have it,...
Video: Tableau with Music / Half-Circle Timelines
Tableau with Music / Half-Circle Timelines. We will combine several Table Calculations to create this visualisation using the Sample Superstore Data Set. Nice and simple.
https://youtu.be/XnH-jqedyKM
Written Tutorial
YouTube Channel
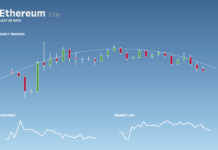
Video: Creating a Cryptocurrency Tableau Dashboard (57 mins)
This is my first long-form end-to-end Tableau Dashboard tutorial. While filming, I was overthinking the editing and production quality, which meant that I almost gave up. In the end, I came...
Creating Square Arc Charts in Tableau
I hope you enjoy this last tutorial before I go on my first break of 2020. This is the technique that I used to create my Premier League Data Visualisation, which...
Video: Tableau with Music / Radial Jitter Bar Chart
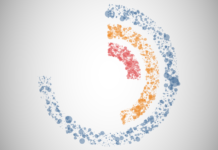
Tableau with Music / Radial Jitter Bar Charts. We will combine the undocumented RANDOM() function with several Table Calculations to create this visualisation using the Sample Superstore Data Set. #NoDataDensificationRequired
https://youtu.be/YBtiXPHxwyw
Written Tutorial
YouTube...
Creating Curved Bar Chart in Tableau (Variation)
During my break periods, I used to post cool data visualisations that I have found on various websites, yes, I really browse a lot. One was a variation of my Curved...
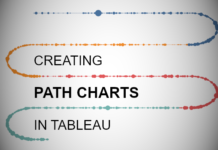
Creating Path Charts in Tableau
This is a tutorial that I have been wanting to write for over a year, however, the mathematics behind this really eluded me. Then one lazy Sunday, I decided to have...


