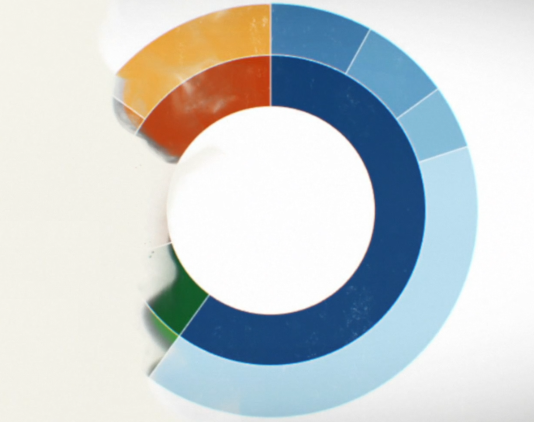
B28. Drawing your Second Ring
We will now add our second layer to our Sunburst which will complete our bespoke data visualisation from a functional point of view. Once we have our second layer, we can add additional layers through manipulating our data source.
B27. Drawing your First Ring
We are going to complete our first layer of our Sunburst using additional Table Calculations to position our segments around the circle. We will need to move our segments around and make sure they are relative to each other.
B26. Drawing your First Segment
Using our prepared data source, we are going to draw our the first segments of our Sunburst chart so that we have a basic understanding of the mechanics. This is always the important first step as we will very quickly see if this is going to be fit for purpose.
B25. Preparing your Data
We will prepare our data source for our Sunburst chart by taking into account the Data Densification technique. We will also go into how we can make this as flexible as possible, especially as we may want to use this in our production dashboards.
B24. What is a Sunburst
We are going to explore a Sunburst Chart. We will look at when could it be used, what use cases could it be appropriate for and, more importantly, when not to use it.
B23. Design Summary
A lot of people look at visualizations and think that they can never build it, however, this could not be further from the truth. Once you see a data visualization, you can distil, sketch and design a bespoke visualisation that can be built in Tableau.
B22. Sketching your Design
The final step is choose and sketch out our bespoke data visualisation; this will give us our basis for our Tableau design and build using the techniques we have learned so far.
B21. Distilling the Essence
Once you have found some inspiration, we will go through the process of distilling this down to its fundamental parts. We will work on pen and paper, go through my process, and start sketching out our various possibilities for our bespoke data visualisation.
B20. Finding Inspiration
We are going to talk about the various sources of inspiration that is at your disposal. You can find inspiration anywhere you look, you just have to pay attention, be aware, be open and let it come to you.
B19. Introducing Design
In this section, we will talk about finding inspiration, sketching and designing your Bespoke Data Visualisations in Tableau.


