Video: Tableau with Music / Half Circle Chart
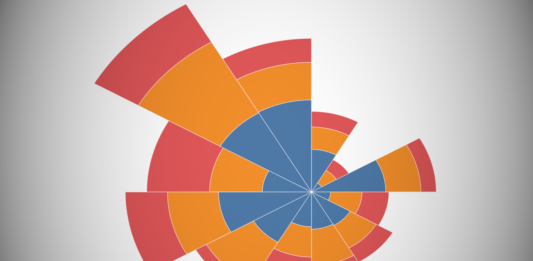
Using a few neat tricks and some Table Calculations, we have created this awesome chart in Tableau. Enjoy.
https://youtu.be/Y6fS_QLw9yk
YouTube Channel
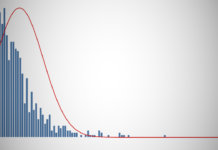
Video: Tableau with Music / Histogram with a Normal Curve
Tableau with Music / Histogram with a Normal Curve. We will create several Level of Detail Expressions to create this data visualisation. See how each the distribution of your data compares...
Video: Tableau with Music / Marimekko
Using a few neat tricks and some Table Calculations, we have created this awesome chart in Tableau. Enjoy
https://youtu.be/6FGSGu5QLKo
YouTube Channel
Written Tutorial
Video: Tableau with Music / Square Bump Chart
Tableau with Music / Square Bump Chart. This awesome variation of your standard Bump Chart (League Table) using Data Densification and Table Calculations to create this using the Sample Superstore Data...
Video: Tableau with Music / Gradient Bar Chart
We will combine several Table Calculations to create this visualisation using the Sample Superstore Data Set. I hope you enjoy this.
https://youtu.be/7SfLzRP-eME
Written Tutorial
YouTube Channel
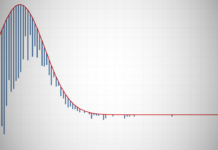
Video: Tableau with Music / Rootogram
Tableau with Music / Rootogram. We will create several Level of Detail Expressions to create this unique Rootogram Diagram. See how each the distribution of your data compares to the Normal...
Video: Tableau with Music / Control Charts
Using a few neat tricks and some Table Calculations, we have created this awesome chart in Tableau. Enjoy.
https://youtu.be/2qQvQNtCUzY
YouTube Channel
Written Tutorial
Video: Tableau with Music / Half-Circle Timelines
Tableau with Music / Half-Circle Timelines. We will combine several Table Calculations to create this visualisation using the Sample Superstore Data Set. Nice and simple.
https://youtu.be/XnH-jqedyKM
Written Tutorial
YouTube Channel


