Drawing Process Circles in Tableau
I do love drawing visualizations in Tableau and every time I see something interesting on a website, PowerPoint deck, magazine or any other presentation tool, the first thing that comes to...
Tableau’s JavaScript API / An Introduction
In the past 5 years, I have been programming a lot with JavaScript, from simple jQuery to Angular to React. This has been mainly for my personal projects and surprisingly I have...
Tableau QT: Dual Bar Charts
This is a Quick Tip on how to build Dual Bar Charts in Tableau, so less reading and more jumping in. We are going to spend 5 minutes or less building...
Drawing Satellite Charts and Variations in Tableau
A lot of the articles written have either come from browsing bespoke designs or through client requests. I am normally the one that is called in when a client requests a...
Tableau UI / An Introduction
Tableau UI is a React component library containing UI components for building web applications with the Tableau look-and-feel. In this introductory tutorial, we will set up our development environment (and relevant...
Tableau QT: Dumbbell Charts
This is a Quick Tip on how to build Dumbbell charts in Tableau, so less reading and more jumping in. We are going to spend 5 minutes or less building our...
Creating a Web Data Connector / Part 1
One of the top features of Tableau is that they provide out-of-the-box connectivity to a variety of common data sources; the number of supported data sources is increasing with every release...
Drawing Google Logos
I do not believe that everything you do in Tableau has to be serious, and sometimes, just sometimes, it is good to have some fun. As such, we are going to...
Tableau QT: Lollipop Charts
This is a Quick Tip on how to build lollipop charts in Tableau, so less reading and more jumping in. We are going to spend 5 minutes or less building our...
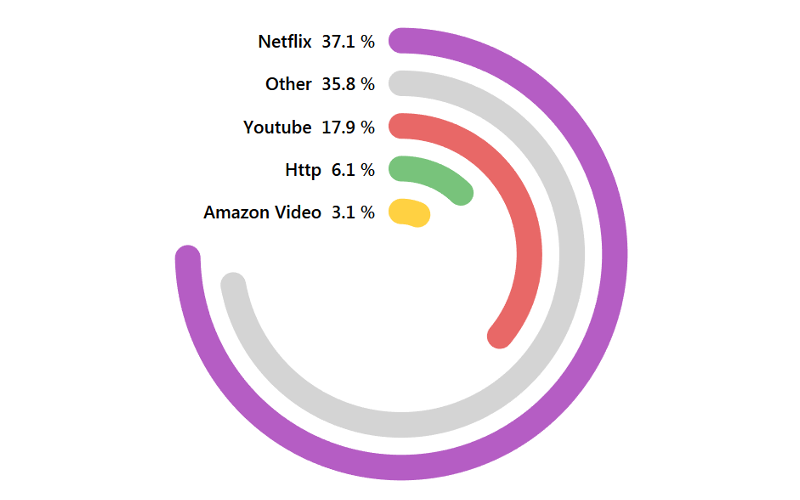
Radial Bar Chart Tutorial
I love drawing data visualisations with Tableau and in this tutorial, we are going to build Radial Bar Chart. For my data set, I am going to use the #MakeoverMonday’s American...


