


")


Tableau Zen Master. Analytics Strategist & Architect. Assistant Director, BI at Bucknell
Twitter: @flerlagekr
Website: https://www.kenflerlage.com
A year ago, Ken would have told you that he has an identical twin brother, but now that Kevin is an active member of the Tableau community, everyone knows that. Ken is happily married to his wife, Kathy, for 18 years now, who he met when both were studying abroad in Glasgow, Scotland, and been together ever since
Ken then moved from Kentucky to Pennsylvania to be with Kathy within months of returning home from Scotland.
Ken and Kathy have two kids—both teenagers!!! And if he is not at home tinkering with Tableau, it’s a good bet that you will find him at one of their sporting or school events. Ken’s last job required him to travel quite a bit and hated it because he missed too many of their activities, so he tries really hard to never miss anything.
I have chatted to Ken for a while now, so it was nice to have a conversation with him about his journey in data.
Toan: Tell us a little about your background, how did you get into Data Visualisation and Tableau?
Ken: I’ve worked in information technology for over 20 years and I’ve done a little of everything in this field — application development, database administration, ERP administration, etc. Then, a little over six years ago, I was given an opportunity to lead a small analytics program at my previous employer. It was a great opportunity but was also a new field for me. We had invested in another data visualization product that I won’t mention here, but it was then that I discovered the power of data visualization and was immediately hooked. I’ve always loved working in IT, but I knew that I had truly found my passion
Fast forward to early 2016 and I had just accepted a position at Bucknell University. During interviews, I had learned that Bucknell used Tableau. I was familiar with Tableau but had never used it, so I decided to do an online training course prior to starting my new role. I took about a week going through Matt Francis’s Learn Data Visualisation with Tableau 9 course and was really impressed with what it could do. It was so much more powerful and flexible than other products I had used, and I was thrilled that I’d get to use it at work.
But, when I started at Bucknell in April of 2016, I immediately jumped into a more architectural-focused project and didn’t have much chance to work with Tableau. At the same time, however, I had started to have some ideas of some personal data analyses I wanted to perform and write about. I wanted to include some visualizations as part of those blogs, so I decided that I should use Tableau thinking that it would be a good way to practice the skills I’d eventually need at my job. And that’s when it really started to click. The more I analyzed and visualized data with Tableau, the more I realized how powerful it was.
Earlier in my career, I remember encountering people who would go home and write programs in their spare time because they loved it so much. I was not one of those people and I always thought those people were nuts—that is, until I found Tableau. Tableau is not just a tool I use at work, it’s a personal passion and hobby.
Toan: Just how nuts have you become? How much of your free time do you generally spend on Tableau? What do you normally work on? Is this mainly on your blog, or other things?
Ken: Haha! I spend a lot of my free time doing something with Tableau. I’m not sure exactly how much time I rack up in a given week, but it’s quite a bit. It tends to be a combination of a lot of different things. Sometimes, I spend my time building a full-blown visualization, other times I’m building a viz to support a blog post. Sometimes, I’m just playing around, experimenting with things. I also spend a lot of time trying to help others master Tableau. Much of this work happens on the Tableau Community Forums where I’m a frequent contributor. A lot of it also comes from people who reach out to me directly with questions. I really love Tableau, so I can’t get enough!!
Toan: Tableau projects come in various shapes and sizes, personally speaking, what has been the most rewarding work (or project) you have done in the Tableau space, and why?
Ken: Without a doubt, the most rewarding project I’ve been able to work on was my work with Community Solutions through the Tableau Foundation. Community Solutions is an organization that works throughout the United States to end homelessness. I worked closely with their data team to help them to structure their data in a way that is conducive to reporting as well as just acted as a sounding board for any data or Tableau-related questions they had. During this time, I built a great relationship with those people which continues to this day. As you’ve probably heard, the Tableau Foundation just announced a $1.3 million investment to further Community Solutions’ work (for more, see Tableau Foundation and Community Solutions Partnership to Eliminate Veteran and Chronic Homelessness in 50 U.S. Communities) and I am thrilled to have played a small role in helping this amazing organization.
Toan: For those that do not know, what is the Tableau Foundation? How did you get involved with Community Solutions?
Ken: The Tableau Foundation is a charitable organization started by Tableau. Put simply, the foundation helps non-profit organizations to make better use of their data. They do this by donating Tableau licenses, providing training, and by putting those organizations in touch with people who want to use their analytics skills to help. Many of the Tableau Zen Masters, as well as other community members, have played an active role as volunteers with the foundation. When I became a Zen Master last year, helping with one of these projects was high on the list of things I wanted to do. So, when I learned about Community Solutions, I immediately jumped at the opportunity.
Toan: Do you have any other Tableau Foundation or community initiatives that you are looking to participate or lead in the future? What would you say to someone who also wanted to get involved?
Ken: I do not have anything lined up at the moment, but I’m definitely hoping to participate in a Tableau Foundation project at some point this year. For those who want to help, I’d suggest that you look into volunteering with the Tableau Service Corps. It’s a great way to use your skills to help make a difference. You can sign up here: https://servicecorps.tableaufoundation.org/apply
Toan: To add to the above, what was the most challenging project you have experienced in Tableau, and why? How did you overcome this challenge, and what advice would you give to people who experience the same challenge? What would you say to yourself if you had a time machine?
Ken: I’ve spoken and written about this, but my Word Usage in Sacred Texts visualization was very challenging. While this visualization included some technical complexities, primarily the collection, cleaning, and parsing of six of the world’s religious texts, the most challenging aspect of the viz turned out to be how best to communicate my insights. I started in small steps by visualizing the words of the Bible, then the Tao Te Ching, then the Bhagavad Gita, but never thought about comparing them all until someone suggested that I do so in a blog comment. From there, I attempted to look at the data in a number of different ways. I’d try something out, creating a visualization, but then put it back on the shelf because I felt that it just didn’t tell the whole story. Finally, it occurred to me that I needed to bring all of them together to create a single work. Once I did that, it felt like it really worked and did the topic justice. In all, this project took over 6 months of experimentation before it all came together. But I’m glad that I took the time and worked through all the issues because, to date, this is my most popular visualization and one that has seemed to resonate with a lot of people. So, my advice to anyone who may be experiencing the same sort of challenge would be to just be patient. If you are not under any strict time constraints, then take the time you need, experiment with different ideas, ask for advice from others, and don’t settle for something you don’t feel is ready.
Toan: What is your process for designing and putting together a visualisation? Do you brainstorm in Tableau? Using
Ken: Honestly, I’m kind of all over the place. Sometimes I get an idea in my head of how I want something to look then it’s just a matter of executing in Tableau. Other times, I’ll sketch something on paper. But, most of the time, it’s just a matter of using Tableau to explore the data and explore different ways to tell that data’s story. This is one of Tableau’s strengths, so I use it to do what it’s great at.
For inspiration, I look everywhere. I am inspired by news articles, magazines, flyers, other people’s work, etc. Inspiration doesn’t come from just one thing or person. It seems that my eyes and brain are trained to always search for inspiration as I go through my life.
Toan: Tableau is amazing, where do you see Tableau going in the next few years. What features would you love to see, or functionality improved upon?
Ken: Well, one of my wish list items—transparent sheets—was just released in 2018.3 so that made me very happy. With all the incredible features that Tableau releases on a regular basis and the amazing ways the community finds to use them, it almost feels selfish asking for more. But if I had to pick one it would be broader font support. The number of fonts supported on published visualizations (i.e. on Tableau Server or Tableau Public) is pretty limited, so I’d love to have the ability to use a wider range of fonts.
One thing I do want to note here is how much respect I have for the Tableau dev team. It’s easy for software users to scream about the features they need, but it’s a whole other thing to actually deliver on those requests. What amazes me time and again about Tableau’s dev team is that they don’t just give us features we want—they extend the platform in a way that allows us to meet those needs, while also addressing lots of other potential needs. That may sound like a bit of word craft but let me give you an example. In 2018.3, Tableau gave us Set Actions. This feature has opened up a whole new world of capabilities to Tableau users. I recently told someone at work that, if they encountered something they didn’t think was possible, it’s likely we can find a way to do it with set actions. That’s how powerful this feature is. But none of us users were out there screaming “give me set actions!” We were asking for very specific pieces of functionality. Tableau could have addressed each of those one-off items, but instead, they gave us a powerful feature that allows us to address all of those items and much much more. That’s what I love this about the dev team. They don’t give us what we ask for—they extend the platform in a way that gives us the flexibility to do that and much more.
Toan: Indeed, I remember moaning about dynamic parameters for years, and since Set Actions, and Parameter actions coming soon, I think the DEV team are absolutely fantastic. Transparent sheets are awesome, but I actually did not think much of it until it came. Why did it feature on your wishlist? And what doors do you think this opens up for us all?
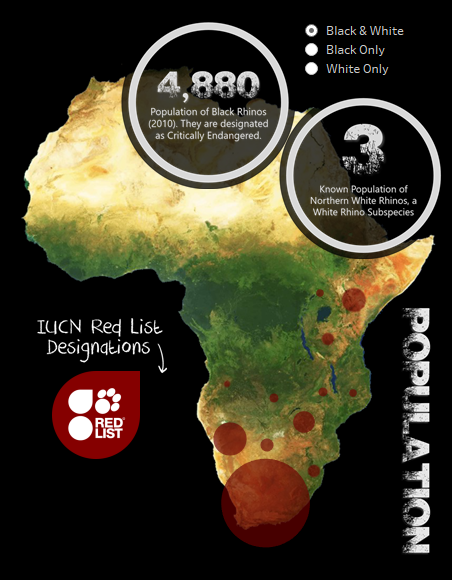
Ken: For my personal work, I often float objects on a dashboard, and I might have multiple components sort of stacked on top of each other. Take, for example, this section from The Killing Fields, my viz on the Rhino poaching problem. I have a map with some objects floating on top of it. These are images, but had transparent sheets been available, these could have been sheets with transparent backgrounds. Without that feature, I would either have to use images, as I did in this case, or each sheet would have an ugly background color which would have made it impossible to float them over the map.
I think that transparent sheets open up a ton of different possibilities. Some of those possibilities are just simple things like the above, but they also allow you to introduce layering into a visualization. For example, I recently created the following viz showing births by day in the United States.

For the initial view, I didn’t want any annotations or extra stuff—I just wanted it to look like a piece of art. But I also felt that the context was pretty important, so I added two toggles that allow you to turn on a grid and/or turn on annotations.
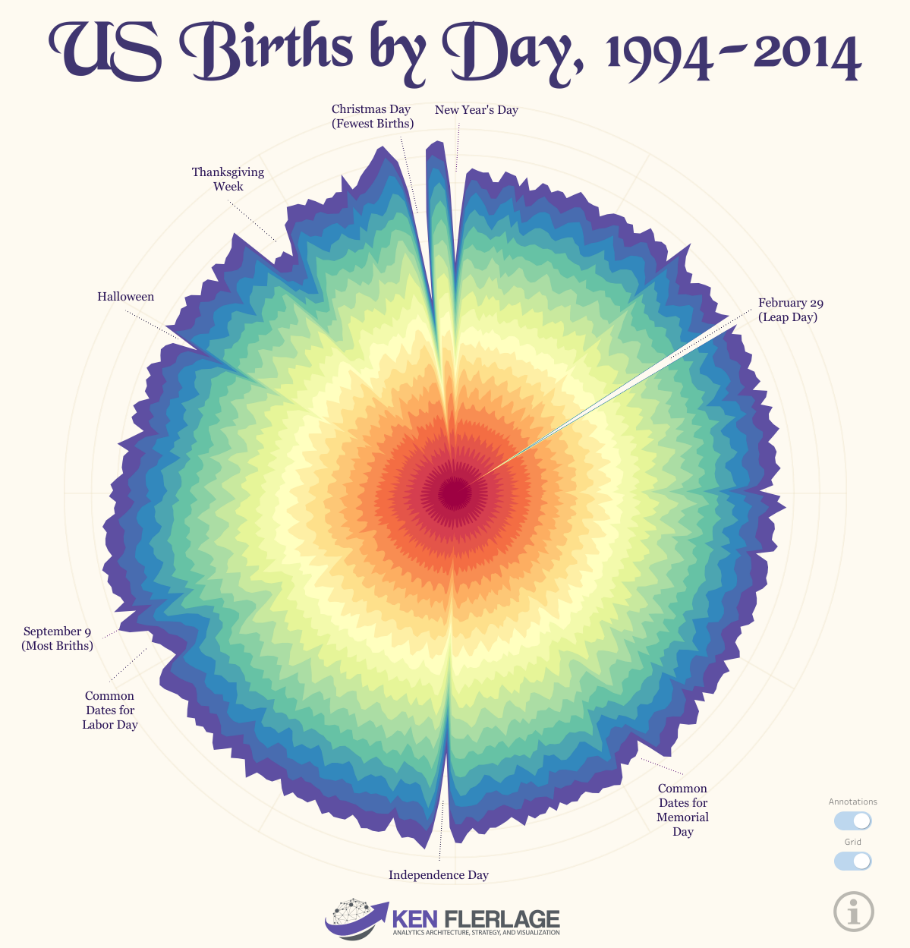
The grid and the annotations are just additional sheets that sit underneath the main sheet. Without transparent sheets, this is pretty difficult to do, but withtransparent sheets, it’s super simple.
Toan: Broadly speaking, is there anything currently in the Tableau roadmap or current features that really get you excited about the tool set? I am ashamed to admit that I have not explored Set Actions fully, is there anything that you have not explored or want to explore more of?
Ken: I don’t like for other people to have all the fun innovating with new features, so I typically try to explore them as soon as they become available. I haven’t been great about participating in betas, so that’s definitely something I want to do more of, so that I can help tune the new features before they are released. One thing I’m really looking forward to is parameter actions. It’s a feature that, like set actions, will open up a lot of new possibilities. I haven’t experimented with the feature yet but am hoping to do so soon.
Toan: Tableau has an amazing community for learning and there are loads of places to go. What is your top tip for really excelling within Tableau, what is your secret?
Ken: I only get one?? I actually just wrote a blog about my 4 Tips for Mastering Tableau: Train, Practice, Engage, Teach. I think they are all equally important to the development of your Tableau skills. Training is so important as it gives you a strong foundation upon which you can build. Practice is critical as you can’t get better at anything without practice and effort. Since Tableau has such a strong community, with people sharing their knowledge and their work, Engaging is a very powerful way to learn and gain inspiration (not to mention finding like-minded people). And Teaching forces you to think about different types of problems and to get out of your comfort zone. So, how about four instead of one!
Toan: If you had to do it all over again, would there be something that you would have changed in your journey? Or something you wished you focused on a lot more?
Ken: Hmm, good question. My journey has been so much fun that I’m not sure I would change much, to be totally honest. Perhaps the only thing would have been to discover the community earlier on. I spent my first few months just figuring things out on my own—I didn’t realize that there was such an active, engaging, and helpful community out there. I certainly wish I had known this on day one as it would have definitely helped me to avoid lots of rookie mistakes.
Tableau Zen Master. Analytics Strategist & Architect. Assistant Director, BI at Bucknell
Twitter: @flerlagekr
Website: https://www.kenflerlage.com
A Conversation with Season 1:
- Episode 1 / Mark Bradbourne
- Episode 2 / Josh Tapley
- Episode 3 / Lindsay Betzendahl
- Episode 4 / David Pires
- Episode 5 / Dilyana Bossenz
- Episode 6 / Yukari Nagata
- Episode 7 / Emily Kund
- Episode 8 / Ken Flerlage
- Episode 9 / Sarah Burnett
- Episode 10 / Merlijn Buit


