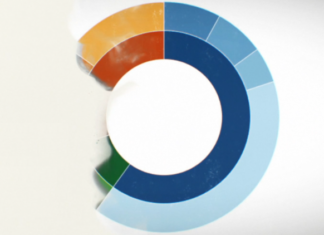
Creating Squared Spiral Column Charts in Tableau
Two weeks ago, we released our Spiral Column Chart Tutorial in Tableau using the Line Mark Type. In this tutorial, we are going to create a Squared version using the Polygon...
Video: Tableau with Music / Curve Bar Charts
Tableau with Music / Curved Bar Chart. This awesome variation of a Bar Chart leverages Data Densification and Table Calculations to create this awesome effect over the Sample Superstore Data Set.
https://www.youtube.com/watch?v=9gtdra7260U
Written...
Creating Spiral Column Charts in Tableau
This is something that I have been wanting to create for a while, but alas, I put this on my backlog until I could figure it out. As such, I hope...
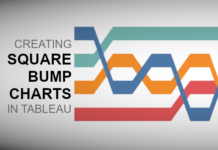
Creating Square Bump Charts in Tableau
A tutorial that was requested by one of my students on Udemy, this is a variation of the bump charts that you may be used to seeing, but also quite different...
Creating Gradient Backgrounds in Tableau
When I created my Cryptocurrency Dashboard, I decided to have some fun with gradient backgrounds. When combined with animations, this creates a very cool effect, so here you go, a nice...
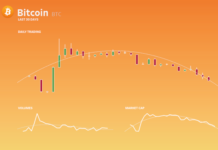
Cryptocurrency Dashboard Full Tutorial
Once a month, I am going to write a full feature-length tutorial on creating an intricate multi-feature dashboard for you to work through and enjoy. We are going to start with...
Creating Radial Jitter Bar Charts in Tableau
I created this a while ago, and only now have had a chance to write a tutorial on creating Radial Jitter Bar Charts. Truth be told, I spent time digesting the...
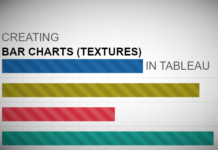
Create a Bar Chart (Textured) in Tableau
Requested by a student, here is a tutorial on adding Textures to Bar Charts to create a very nice and interesting effect. This uses data densification as well as images in...
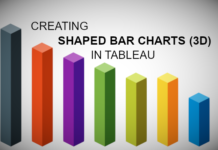
Shaped Bar Charts (3D) in Tableau
We previously had an article about creating Shaped Bar Charts in Tableau; in that previous tutorial, we used data densification to create a different look and feel for our bar charts....
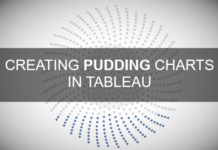
Creating a Pudding Chart in Tableau
I love drawing in Tableau and a few months ago, I saw an image of a Sunflower and I wondered if there is a mathematical way to create this, I found...


