Creating Radial Column Charts in Tableau
This is a quick tutorial on creating a Radial Column Chart in Tableau. I have seen so many interesting ways that this has been used, so I really hope you enjoy...
Creating a Coxcomb Chart in Tableau
I had this one on my radar for so long now, literally, ever since I ventured in Bespoke Data Visualisations in Tableau. A student requested this tutorial, so I thought I...
Creating Gradient Bar Charts in Tableau
Gradients are not best practice for data visualisations. To put it out there immediately. However, it is something that is often asked for when creating infographics, or when the key objective...
Preparing Spatial Data for use in Tableau
Each graphical representation is much more effective if spatial data is used. Tableau supports Spatial data, and .SHP files are the most commonly used source of data, but what are these?.
What...
Creating Gauges in Tableau
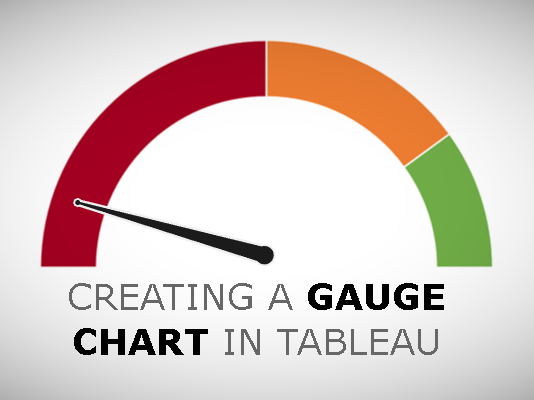
Another Tableau Tutorial request. Here is a tutorial on creating Gauges in Tableau. In this tutorial, we are going to show the colour-coded percentage out of 100.
Note: This is an alternative...
Creating Half Circle Gauge Charts in Tableau
Requested from a friend, here is a nice and simple tutorial on creating Half Circle Gauge Charts in Tableau. In this tutorial, we are going to show the colour-coded percentage out...
Creating Layered Area Charts in Tableau
Just for some variety, check out this simple and fun blog about create Layered Area Charts in Tableau. We are literally using our data to draw the area chart using polygons,...
Creating Jitter Bar Charts in Tableau
Yes, I create this data visualisation a little while ago, and while hesitant about it, decided to write a nice, quick and simple tutorial about how you can create these in...
Creating Spiral Hex Charts in Tableau
I thought I would have some fun and create a challenge for myself and create a Spiral Hex Chart in Tableau. Unfortunately, while I was not able to fully make this...
Drawing Neon Bar Charts in Tableau
Sometimes you just have to have fun with Tableau, and given I was too preoccupied to participate in the Music themed IronViz qualifier, I had to create something music-based, and I...


