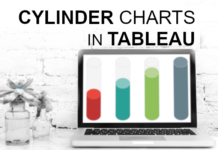
Cylinder Charts in Tableau
I was going through Google looking for data visualisation inspiration and came across a thread in the Tableau Forum which talks about creating a Cylinder Chart, and more interesting, if it...
Waffle Charts in Tableau
This is one of the most requested tutorials, so I thought why not write it for a little fun. Yes, it a fun Waffle Chart. Now, I could use a scaffold...
Circular Jitter Plots in Tableau
Yes, I have been experimenting with Jitter Plots recently, and created the following Circular Jitter Plot in Tableau; this type of chart does create a distinct and unique look, so I...
Filled Circle Charts in Tableau
I created this tutorial a little while ago, but the math did not quite add up, so I had to remove the tutorial. After a little while decided to revisit this, and as such, here is my latest version of my Filled Circle Tableau data visualisation tutorial.
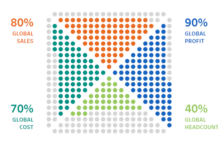
Dot Quadrant Chart in Tableau
I regularly look through websites for design, Pinterest, and other resources for ideas and regularly post to my Facebook Group. After posting one image, I received several messages about creating this...
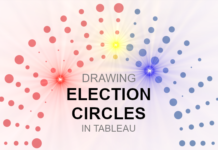
Drawing Election Circles
There have been a lot of requests to create this tutorial, especially with the upcoming elections, yep, I am starting to get excited about the election season. As such, here is...
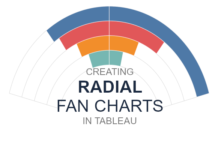
Radial Fan Charts in Tableau
I was looking for inspiration for my second Epic Viz and thus was experimenting with Tableau to see what can be done. In the process, I put together a Radial Fan...
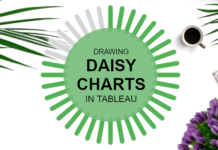
Drawing Daisy Charts in Tableau
On my way home from the London Tableau User Group (TUG) I was looking at Twitter and got inspiration from Kevin Flerlage (@FlerlageKev) and Rajeev Pandey (@rajvivan), so I thought I...
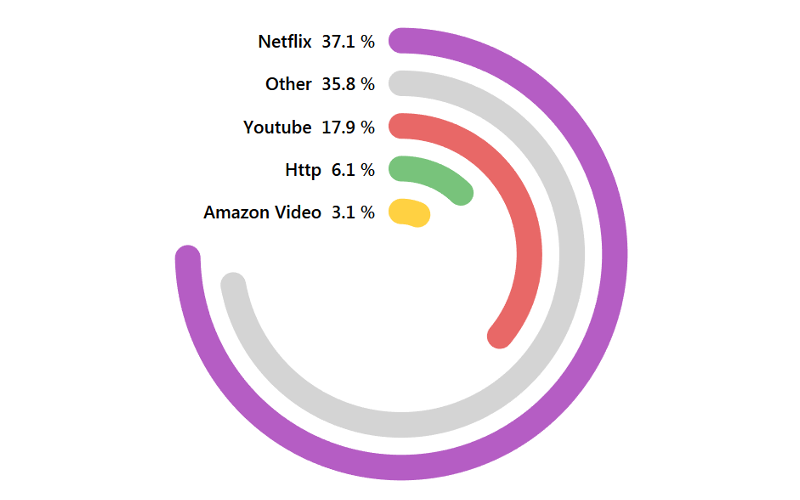
Drawing a Combined Radial and Rounded Bar Chart in Tableau
I was browsing Pinterests for interesting visualisations and came across a visualisation that combined a Radial Bar Chart with a Rounded Bar Chart, and as such, I knew that I had...
Tableau Server Quiz / 1
Our Tableau quizzes have been designed to help you test your learning as well as to be fun. Each question will also come with an answer and hopefully show you something...


