Creating Half Circle Gauge Charts in Tableau
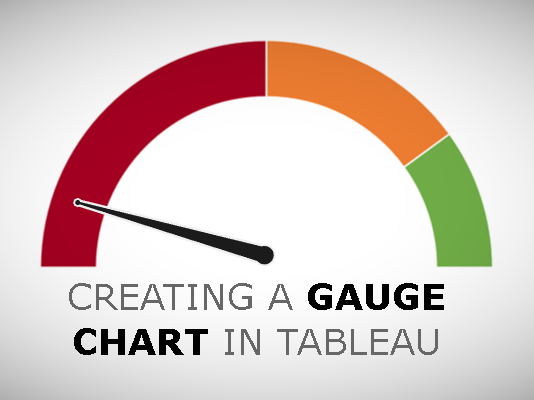
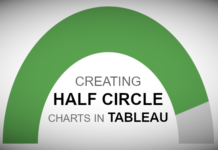
Requested from a friend, here is a nice and simple tutorial on creating Half Circle Gauge Charts in Tableau. In this tutorial, we are going to show the colour-coded percentage out...
Creating Calendar Circle Charts in Tableau
This is another chart type that been requested, and while I created and published this on Tableau Public a while ago, I have only just gotten around to writing the tutorial....
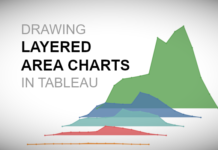
Creating Layered Area Charts in Tableau
Just for some variety, check out this simple and fun blog about create Layered Area Charts in Tableau. We are literally using our data to draw the area chart using polygons,...
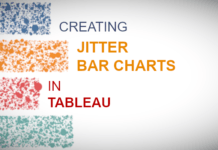
Creating Jitter Bar Charts in Tableau
Yes, I create this data visualisation a little while ago, and while hesitant about it, decided to write a nice, quick and simple tutorial about how you can create these in...
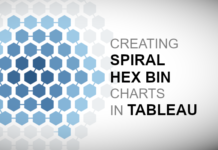
Creating Spiral Hex Charts in Tableau
I thought I would have some fun and create a challenge for myself and create a Spiral Hex Chart in Tableau. Unfortunately, while I was not able to fully make this...
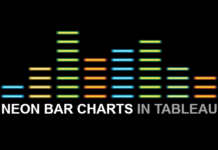
Drawing Neon Bar Charts in Tableau
Sometimes you just have to have fun with Tableau, and given I was too preoccupied to participate in the Music themed IronViz qualifier, I had to create something music-based, and I...
Drawing Layered Filled Circle Charts
I created this bespoke data visualisation I had more time and more actively participating in #MakeoverMonday and for the UNESCO-IHE. I wanted to create a slightly different take on a stacked...
Creating Ternary Plots in Tableau
This is my last tutorial until I go on my August Tableau Magic break, and as such, I want to finish with a comprehensive tutorial on creating Ternary Plots in Tableau;...
Tableau Magic on Udemy
After months of planning, endless preparation, and loads of refilming, I am finally ready to make public my first Udemy Course on Creating Bespoke Data Visualisations in Tableau. Since starting Tableau...
Sectioned Radial Jitter Plots in Tableau
In the recent 2nd #IronViz Feeder round for the Global competition, I created a sectioned Radial Jitter plot, which was adapted from the Tableau Magic Circular Jitter Plot tutorial. You can...


