Having Fun with Overlay Shapes in Tableau
I am not the biggest fan of using floating shapes and, if possible, like to create all my data visualisations through drawing polygons. However, a lot of people on my Facebook...
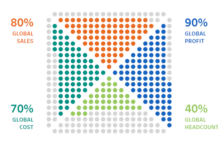
Dot Quadrant Chart in Tableau
I regularly look through websites for design, Pinterest, and other resources for ideas and regularly post to my Facebook Group. After posting one image, I received several messages about creating this...
Drawing Election Circles
There have been a lot of requests to create this tutorial, especially with the upcoming elections, yep, I am starting to get excited about the election season. As such, here is...
Drawing a Circle Dot Chart
I saw the following while looking for inspiration and thought that this would be fun to build, to build this visualisation as well as to include some neat variations. This should...
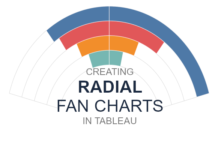
Radial Fan Charts in Tableau
I was looking for inspiration for my second Epic Viz and thus was experimenting with Tableau to see what can be done. In the process, I put together a Radial Fan...
Drawing Daisy Charts in Tableau
On my way home from the London Tableau User Group (TUG) I was looking at Twitter and got inspiration from Kevin Flerlage (@FlerlageKev) and Rajeev Pandey (@rajvivan), so I thought I...
Tableau Magic EpicViz vol.1
This is going to be a longer post than most as I want to give you the full idea behind this visualisation as well as show you how to combine several...
Drawing a Combined Radial and Rounded Bar Chart in Tableau
I was browsing Pinterests for interesting visualisations and came across a visualisation that combined a Radial Bar Chart with a Rounded Bar Chart, and as such, I knew that I had...
Drawing a WiFi Symbol
I do like having some fun with Tableau and in this blog we are going to use Data Densification to draw a simple WiFi Symbol. This will be quick, fun and...
Drawing a Drop Off Sankey Chart in Tableau
Tableau Magic has experienced a fantastic launch and I am extremely grateful for your support. One of the ways I have been monitoring the growth of Tableau Magic is via Google...


