Tableau QT: Rootogram
Last week our Tableau Quick Tip was on creating a Histogram with a Normal Distribution Curve. This week we are going to build a variation of this and our Rootogram (hanging...
Create a Bar Chart (Textured) in Tableau
Requested by a student, here is a tutorial on adding Textures to Bar Charts to create a very nice and interesting effect. This uses data densification as well as images in...
Tableau QT: Histogram with Normal Curve
Welcome to 2020. Hopefully, this will be the start of a glorious year, and we at Tableau Magic are definitely excited for things to come. Here is our first Tableau Quick...
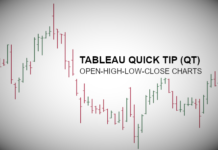
Tableau QT: OHLC Charts
In this Tableau Quick Tip, we are going to create an Open-High-Low-Close (OHLC) chart in Tableau, we will do this within 5 mins or less.
Data
Let us start by loading the following...
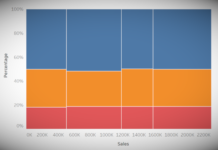
Creating a Marimekko Chart in Tableau
To close off there year, he is a quick and simple tutorial on creating a Marimekko Chart in Tableau. No data densification or any such data tricks. Just a few Table...
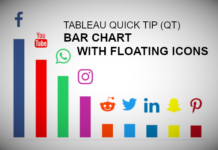
Tableau QT: Bar Chart with Floating Icons
Requested from a student, here is a Tableau Quick Tip (QT) on creating a Bar Chart with a floating icons. So in 5 minutes or less, we are going to build...
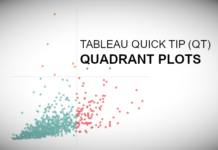
Tableau QT: Quadrant Plots
I love Quadrants Plots as a quick way to segmenting your data, so please enjoy this Tableau Quick Tip (QT) which you can do in 5 mins or less.
Data
Let us...
Tableau QT: HEXBIN Charts
Last week we released a tutorial about the new Distance function in Tableau 2019.3; I really love this function and can see so many interesting applications. This week we are going...
Color Your Viz
"Colors are perhaps the visual property that people most often misuse in visualisation without being aware of it“. Robert Kosara, Senior Research Scientist at Tableau Software
In my last blog article, I...
Tableau QT: Volume Dial Chart in Tableau
Ok, yes, I call these volume dials as that is what it reminds me off, but this is also known as Cleveland Dot Charts, but in any case, please enjoy this...


