Marketing Dashboards: The Do’s & Don’ts
Analytics dashboards are a critical resource for marketing teams that help support their roles and responsibilities, strategic planning, and data-driven decision-making in their daily routines.
With rich data to glean, marketers—especially CMOs—now...
My Top 5 Free Stock Images
I have always had a tough time with backgrounds images for Data Visualizations. On one hand, they can enhance the appeal and engagement of a dashboard if used well, and on...
Tableau Acquisitions / 2003 to 2018
In 13 years, Tableau has grown, gone public, and at the point of writing this article, has a market Capitalization of $7.86 billion. But despite this, Tableau has not acquired many...
Information is Beautiful by David McCandless
A colleague got me a copy of Information is Beautiful by David McCandless as a present a few years ago, and still sits on my coffee table and is still a...
Inspired Dashboard Designs
I am always looking for Dashboards designs for inspiration, and in this article, I have given several links to amazing looking dashboards. It may be possible to create some of the...
Introducing TabJolt
When deploying Tableau an Enterprise we the end-users do not just get a slick data-discovery, self-service and data visualisation tool, but something quicker than they have ever seen before. When deploying...
Understanding Level of Detail (LOD) Expressions
Prior to Level of Detail (LOD) Expressions, we had to make a extensive use of Table Calculations, but LOD has added a new element to the game and well worth looking...
10 Best Practices for Building Effective Dashboards
This Tableau Whitepaper requires registration to read but essential reading for all developers. 10 Best Practices for Building Effective Dashboard is there as a timeless reference.
"When a dashboard is done right,...
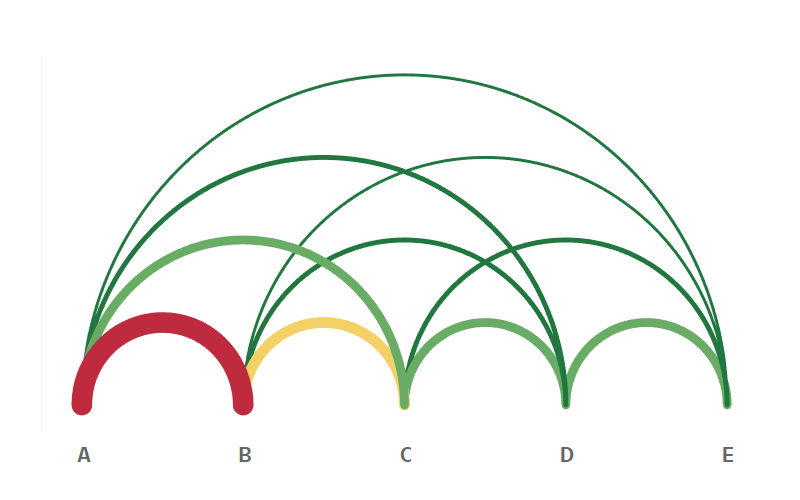
Arc Chart Tutorial
After years of using Tableau, I was finally given a use case that would allow me to create an Arc Chart; I always strive to build the best visualization for the client’s requirements. The client wanted to visualize...
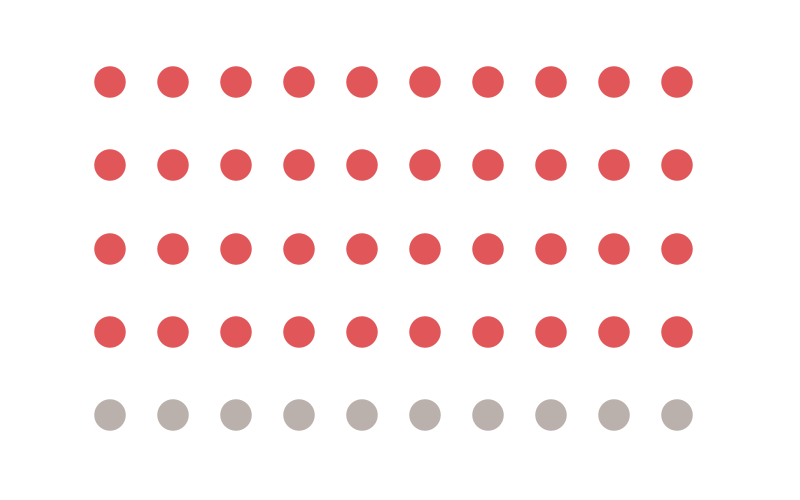
Dot Matrix Tutorial
A friend messaged me to ask he could create a grid layout for different visualisations, for example, a 3×3 grid. I immediately thought about a Dot Matrix visualization and how I could create...


