How Love Works Tableau Dashboard Tutorial
As well as written tutorials, interviews and opinion pieces, we will now be releasing end-to-end guides on building dashboards, and we will start with my How Love Works Tableau Dashboard; this...
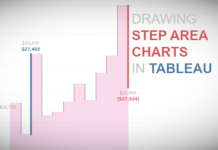
Drawing Step Area Charts in Tableau
Step Line Charts have been introduced with Tableau’s 2018.1 release and it’s really hard to remember that there was a time before, where it needed a little hack to create such...
Tableau Magic on Udemy
After months of planning, endless preparation, and loads of refilming, I am finally ready to make public my first Udemy Course on Creating Bespoke Data Visualisations in Tableau. Since starting Tableau...
Sectioned Radial Jitter Plots in Tableau
In the recent 2nd #IronViz Feeder round for the Global competition, I created a sectioned Radial Jitter plot, which was adapted from the Tableau Magic Circular Jitter Plot tutorial. You can...
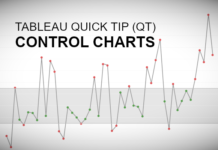
Tableau QT: Control Charts
This is a Quick Tip on how to build Control Charts in Tableau, so less reading and more jumping in. We are going to spend 5 minutes or less building our...
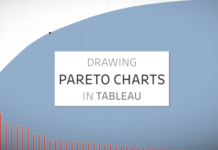
Drawing Pareto Charts in Tableau
Pareto Charts is a type of chart that combines both a Bar Chart and Line Chart; this chart type was named after Vilfredo Pareto who came up with the Pareto Principle...
Drawing Candlestick Charts in Tableau
I have been doing alot of research for an article that I am writting about the Salesforce Acquisition of Tableau. As such, I was looking at the Stock Prices and thought...
Hex Maps in Tableau
I have always had a thing for Hex Maps, so I decided to finally write a tutorial on how you can generate some very interesting Hex Maps. With the help of...
Dot Matrix Tutorial
A friend messaged me to ask he could create a grid layout for different visualisations, for example, a 3×3 grid. I immediately thought about a Dot Matrix visualization and how I could create...


