Creating Radial Column Charts in Tableau
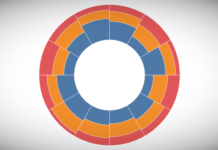
This is a quick tutorial on creating a Radial Column Chart in Tableau. I have seen so many interesting ways that this has been used, so I really hope you enjoy...
Creating a Coxcomb Chart in Tableau
I had this one on my radar for so long now, literally, ever since I ventured in Bespoke Data Visualisations in Tableau. A student requested this tutorial, so I thought I...
Creating Gradient Bar Charts in Tableau
Gradients are not best practice for data visualisations. To put it out there immediately. However, it is something that is often asked for when creating infographics, or when the key objective...
Creating Radial Stacked Bar Chart in Tableau
I saw this a while ago and thought that I would write a tutorial about creating Radial Stacked Bar Charts in Tableau; this is a Stacked Bar Chart based on Percentage...
Preparing Spatial Data for use in Tableau
Each graphical representation is much more effective if spatial data is used. Tableau supports Spatial data, and .SHP files are the most commonly used source of data, but what are these?.
What...
Tableau QT: Quadrant Plots
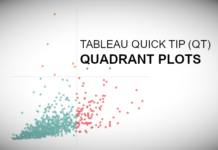
I love Quadrants Plots as a quick way to segmenting your data, so please enjoy this Tableau Quick Tip (QT) which you can do in 5 mins or less.
Data
Let us...
Creating Bar with Trend Chart in Tableau
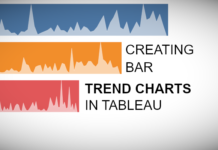
Sometimes, I will get an idea stuck in my head, an image, a type of data visualisation, and I will obsess about it until I have figured out how to create...
Tableau QT: HEXBIN Charts
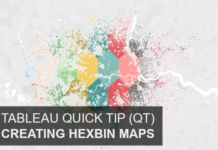
Last week we released a tutorial about the new Distance function in Tableau 2019.3; I really love this function and can see so many interesting applications. This week we are going...
Creating Gauges in Tableau
Another Tableau Tutorial request. Here is a tutorial on creating Gauges in Tableau. In this tutorial, we are going to show the colour-coded percentage out of 100.
Note: This is an alternative...
Tableau QT: Volume Dial Chart in Tableau
Ok, yes, I call these volume dials as that is what it reminds me off, but this is also known as Cleveland Dot Charts, but in any case, please enjoy this...


