Drawing Tally Charts in Tableau
For me, it is important to try new things with Tableau and to push my creativity and skills. As such, here is a nice and simple tutorial on Drawing Tally Charts...
Drawing Curved Bar Charts in Tableau
I was having a quiet weekend and thought I would have a little fun with some bar chart variations, as such, I played around with creating Curved Bar Charts in Tableau....
Drawing Triangle Bar Charts in Tableau
Last week, I was playing around with bar chart variations and created Curved Bar Charts and thought I would also try to create Triangle Bar Charts as well. As noted in...
Hex Maps in Tableau
I have always had a thing for Hex Maps, so I decided to finally write a tutorial on how you can generate some very interesting Hex Maps. With the help of...
Sigmoid Area Charts in Tableau
I was working on an update to our Curved Line Charts and thought about turning this onto a Curved Area Chart, or Sigmoid Area Chart. I am going to be exploring...
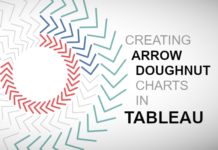
Arrow Doughnut Chart
I saw the following data visualisation and thought that I had to create it, but once I created this I had no idea what I would call it. Baseball Stitches, Chevron...
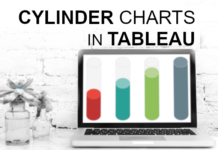
Cylinder Charts in Tableau
I was going through Google looking for data visualisation inspiration and came across a thread in the Tableau Forum which talks about creating a Cylinder Chart, and more interesting, if it...
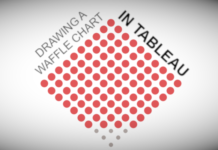
Waffle Charts in Tableau
This is one of the most requested tutorials, so I thought why not write it for a little fun. Yes, it a fun Waffle Chart. Now, I could use a scaffold...
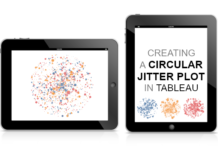
Circular Jitter Plots in Tableau
Yes, I have been experimenting with Jitter Plots recently, and created the following Circular Jitter Plot in Tableau; this type of chart does create a distinct and unique look, so I...
Filled Circle Charts in Tableau
I created this tutorial a little while ago, but the math did not quite add up, so I had to remove the tutorial. After a little while decided to revisit this, and as such, here is my latest version of my Filled Circle Tableau data visualisation tutorial.


